

Oct 31, 2022

5 inbound marketing metrics to track
- Organic traffic sessions
- Keyword rankings
- Session to contact rate
- Attributed revenue
- Social media engagement metrics
Marketing has long involved a good deal of speculation and guesswork.
In the age of outbound marketing, agencies had to guess who was watching a particular show or reading a particular magazine.
The beauty of inbound marketing is that it brings troves of customer data that allow us to see which content is reaching and resonating with our audience.
But this often brings with it the opposite problem: we’ve gone from too little data to too much.
With a nearly endless amount of data at our fingertips, how do we know which metrics are the important ones to watch?
You're in luck. This article will help you cut through the noise to focus on what really matters.
What we get wrong about inbound marketing
The holy trinity of inbound marketing is traffic, leads, and sales. When businesses invest their time and energy, that’s what they’re hoping to get back.
But even these are problematic.
Inbound marketing promises a simple progression: A certain part of our traffic will become leads and a certain number of our leads will become customers. Therefore, if we increase our traffic, we will, in turn, increase our sales.
It’s not always that simple, though. The wrong traffic will not help your bottom line in any way — no matter how much you bring in.
When Marcus Sheridan was developing his They Ask, You Answer business philosophy, he was selling swimming pools and he quickly learned this hard truth about website traffic. 
A particular piece of content could be first-rate as a traffic driver but ineffective for actual sales and revenue.
For example, an article covering the "Top 10 pool toys to buy this summer" could bring in tons of traffic, but not necessarily from people who are serious about installing a pool.
That article would be great for Target or an e-commerce vendor, but for River Pools, because the topic drew mostly unqualified traffic, it was unsuccessful.
As marketers, we need to remember that metrics must be put in context to have meaning — and that we can't just assume traffic will turn into leads.
Your metrics must connect to your goals
In order for any marketing initiative to be successful, it needs to be connected to goals. If you're trying to build awareness, you're likely focused more on traffic, impressions, and social engagement.
If you're focused on sales enablement, your important metrics will be different.
Below, I'll cover five important metrics that can help you understand the results of your inbound marketing. But remember that no number in isolation tells the full story.
Check these 5 metrics regularly
To build a complete picture of the effect your inbound marketing is having, use the tools at your disposal to keep track of these data points. Use each to contextualize the others.
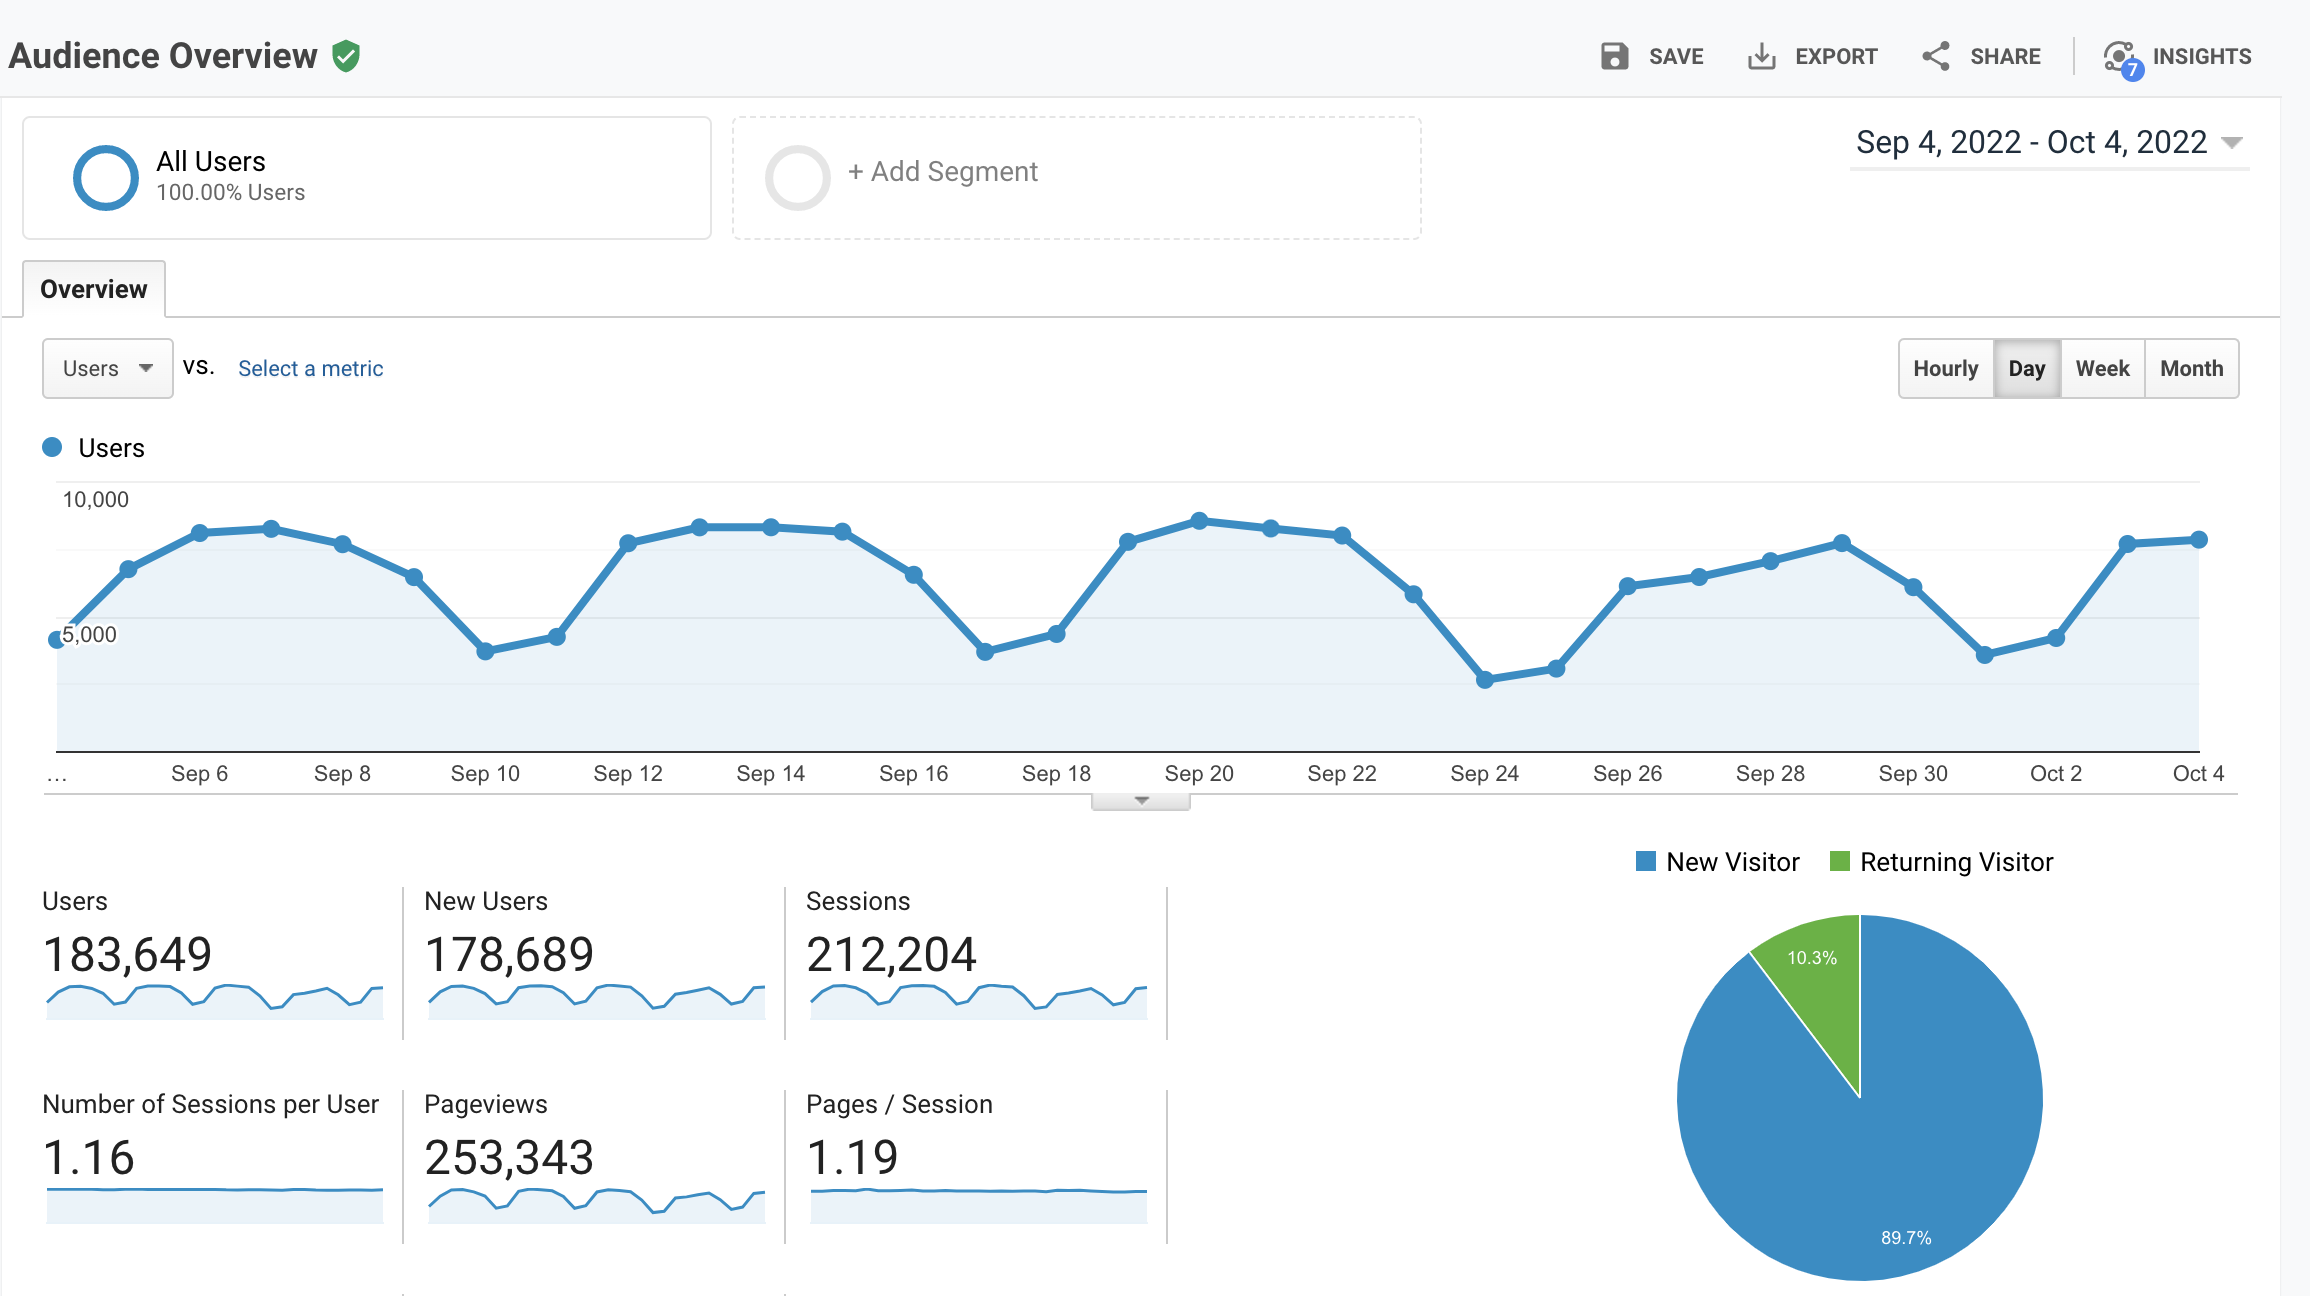
1. Organic traffic sessions
This is seen as the broadest and most bragged-about metric in inbound marketing. While it’s important, it’s also very incomplete.
Tool to use: Google Analytics
What it shows you: Organic traffic means that users are finding your content in search engine results. This means you’ve done well with SEO and that your content is discoverable.
Because people are finding you with search, it means they didn’t necessarily know you even existed before they found you in a search result. This is a big deal.
What it doesn’t show you: Organic traffic doesn’t show you whether those searchers are qualified. It also doesn’t tell you what these site visitors were searching for. (You’ll need to use another tool like Semrush for that.) You also don’t know if they’re staying on your site.
Other data such as dwell time (how long they stayed), page views per session (how many pages they viewed), and bounce rate (how quickly they left) can give you a more complete picture.
How to improve it: Follow SEO best practices to know whether your content can get found by search engines and will be valuable for users. Focus on producing relevant content, starting with The Big 5.
2. Keyword rankings
Keyword ranking should provide a direct correlation with organic traffic, and each should help contextualize the other.
Tool to use: Semrush, Ahrefs, or equivalent
What it shows you: If you’re ranking for certain keywords, it means that search engines and users are finding value in your content.
Rankings give you a better idea about qualified searchers. (If someone is searching "Cost of X?" instead of "What is X?," they are likely more serious about buying.)
Remember, if you’re a tree service company, you want to try to rank for "Tree removal cost" rather than "Top 10 facts about Redwoods National Park."

What it doesn’t show you: Keyword rankings won’t tell you about traffic. For instance, you might rank highly for a unique term that doesn’t get a lot of traffic. Or, you might rank highly but not get clicked in the search results.
How to improve it: Do keyword research to understand searcher intent. When you know what buyers looking to take action are searching for, you can produce content that addresses their questions — which means you’ll attract the right people to your inbound sales pipeline.
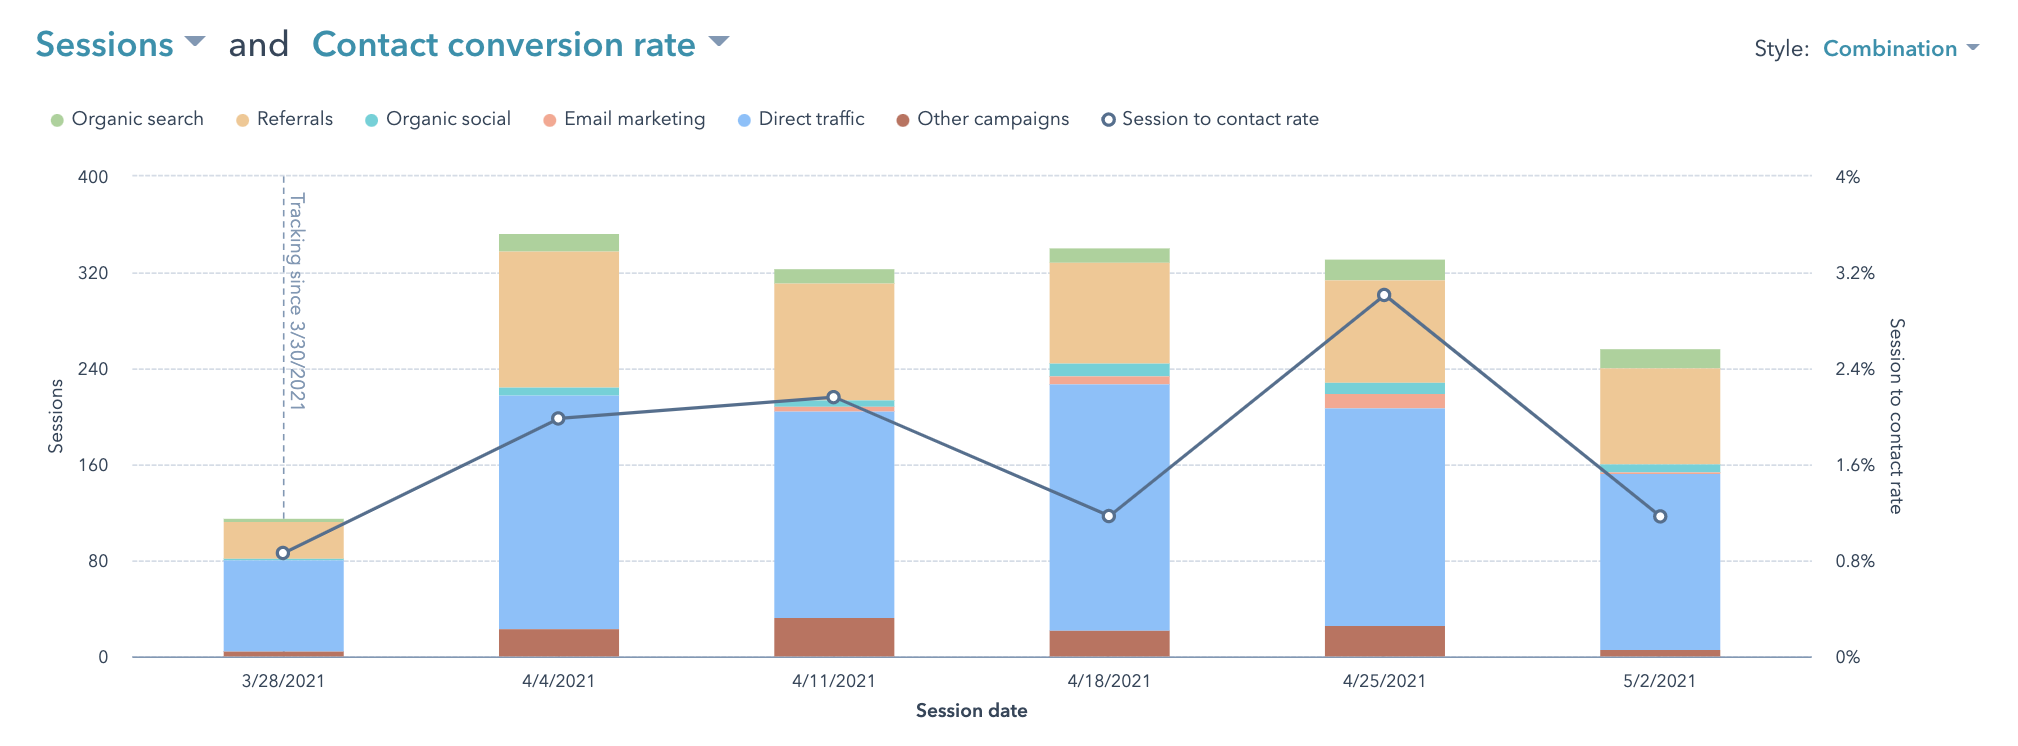
3. Session-to-contact rate
According to HubSpot, session-to-contact rate is "the number of form submissions divided by the number of unique visitors for the selected time period."
Simply put, this number shows what percentage of visitors convert and enter your database for marketing. This could mean they fill out a form, sign up for your mailing list, or download an asset, among other things.
Tool to use: HubSpot (or another CRM that tracks contact data so you can compare it with traffic)
What it shows you: The session-to-contact rate shows that some site visitors are serious about what you do because they’ve gone from reading or viewing a piece of content to taking an action. They've given you their contact information in exchange for an offer or learning more.
What it doesn’t show you: Session-to-contact rate is a better indicator of how qualified visitors are, but it still won’t correlate directly to sales. In the B2B space, you don’t know if the person who fills out the form is actually a decision-maker.
What's more, buyers might not want to convert on an offer before they make a purchase — and visitors who do convert might not become customers.
How to improve it: Make sure your landing pages and CTAs are optimized. Keep testing copy, design, and placement to see what works best.
➡️ Related: What is conversion rate optimization? (definition, examples, and tips)
4. Attributed revenue
When that customer signed on the dotted line, what content brought them to that point? Attributed revenue is the elusive data that attempts to prove ROI. It tells you if a particular piece of content actually led to a sale.
Tool to use: HubSpot (or another tool that can track deal data and pair it with traffic/conversion data)
What it shows you: Attributed revenue shows if your content is making money.
What it doesn’t show you: Attributed revenue attempts to simplify a very complex process. If a customer read 54 articles, signed up for your newsletter, and attended your virtual event, do all those touchpoints share equal responsibility for the sale?
Here’s HubSpot explaining different ways their attribution reporting can be configured to best represent your marketing efficacy:
How to improve it: Make sure your marketers are meeting regularly with your sales team to produce sales enablement content in the language of your buyers.
5. Social media engagement metrics that matter to your organization
I know this feels like a cop-out but bear with me. The world of inbound marketing is changing, and the numbers above aren't always enough.
The fact is, someone could become a customer without reading your content, searching for a keyword, or converting on your landing page.
How?
Usually through social media.
LinkedIn or Instagram followers, YouTube subscribers, a Facebook community. These platforms serve as proxies for your website. Users can consume your content without ever setting digital foot on your site.
So, what numbers do you need to track with these in mind? It will depend on your needs, but some could be:
- Impressions
- Engagement
- Watch time
- Click-through rate
- Subscribers
And more.
These metrics could represent points along the path to becoming a customer — especially when that path is not linear.
Tool to use: Various. Sprout Social and TubeBuddy are great ones to explore.
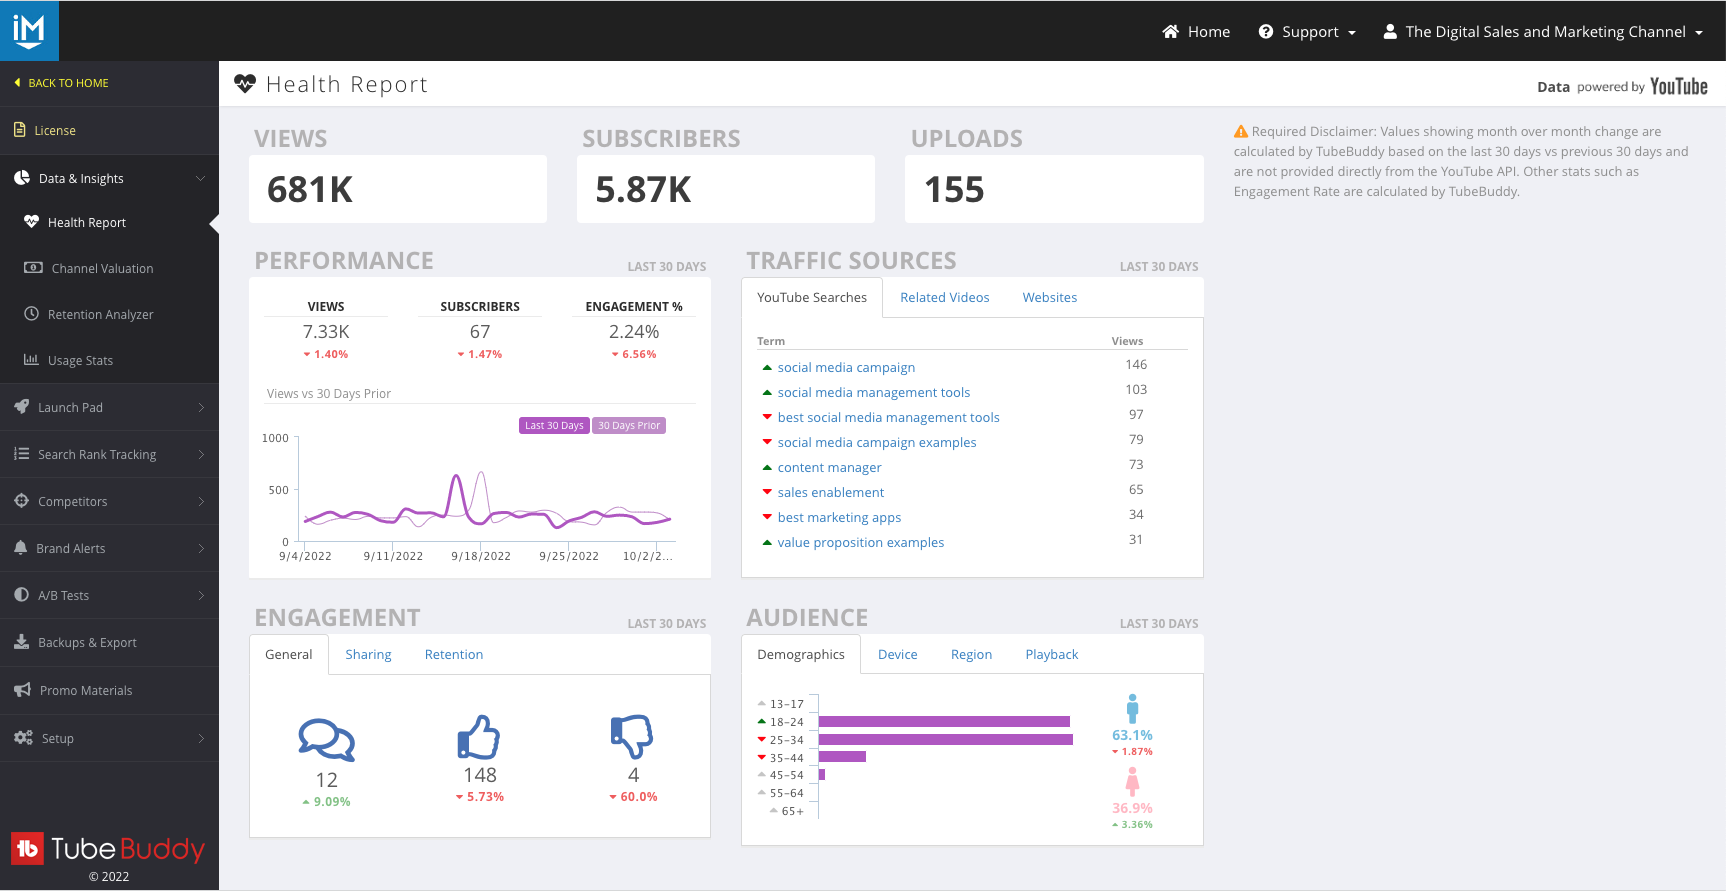
What it shows you: Social media engagement shows just that: Your audience is spending time on social platforms and is engaging with your brand there.
What it doesn't show you: On your website, you can cookie-track your visitors. On social, not so much. It's easy to see who liked your post or commented on your video, but you won't be able to see who read it and kept scrolling, or who watched it and then went elsewhere.
How to improve it: The first step is acknowledging that not all buyers are going to follow the same path down the funnel. Then you can start diverting resources toward social media to engage with your audience there.
You can't see progress without tracking data
This sounds simple and obvious, but it’s worth mentioning. If you want a clear picture of your inbound marketing, start tracking it. At first, you won’t have any data to establish context.
As with anything, the more familiar you become with the format of the data, the more useful it becomes.
What’s a good email open rate? What’s a good closing rate for sales reps? You can look online to find some general ballpark figures, but these might not be specific to your industry, location, or situation.
Say your conversion rate is 4%. Say your bounce rate is 81%. Is that great or terrible? How can you know?
The solution is to just start tracking data.
Build a spreadsheet with what you want to track and add new data points each day, week, month, or whatever makes sense. At first, it will feel useless — tracking all these out-of-the-blue data points — but the more you do it, the more meaning it will have.
Keep in mind, the most useful comparisons are between years. There are always seasonal variations, so comparing Q1 to Q2 will not be as effective as comparing Q2 this year to Q2 last year and the year before.
Your marketing should make you money
When businesses come to IMPACT seeking help with their content marketing, they always say the same thing: We need more traffic, leads, and sales. However, we’ve come to learn that this is always code for the same problem: We need more revenue.
In order to know whether your content is making you money, look beyond those common metrics that most content marketers reference.
Remember, organic traffic from visitors with no intent to buy is not something to brag about. These vanity metrics might look good on a quarterly report, but they won’t help your bottom line. You could have a piece of content without a single organic view that is still a huge success if it’s helping salespeople close deals.
In the end, the goal of all marketing is to drive commerce. Content marketing is no different. You need to look at all the pieces of the puzzle to fully understand how your content helps your customers move through the buying process.
Ready to Get Started?
/Assets/Icon%20Library/x%20corp.svg)
/Assets/Icon%20Library/whatsapp%20logo.svg)
/Assets/Icon%20Library/Email.svg)
/Assets/Icon%20Library/Arrows/Grey%20Arrow%20-%20Prev.svg)
/Assets/Icon%20Library/Arrows/Grey%20Arrow%20-%20Next.svg)