Subscribe now and get the latest podcast releases delivered straight to your inbox.
Ah, the monthly marketing report…
You either take data that’s already in HubSpot and manually type it into a complicated spreadsheet, or if you’re extra fancy, you take the data already in HubSpot and manually type it into a Powerpoint, and within a couple hours, you have a nifty report showing old data.
Unfortunately, you know as a marketer, this isn’t super helpful, but it at least helps communicate to your stakeholders how the previous month went.
I fully admit we were guilty of this too -- Until we found Databox.
Note: Next week, on Tuesday, January 16th, join me and Databox CEO, Pete Caputa for a free webinar teaching you exactly “How IMPACT Consistently Hits Aggressive Marketing Goals by Being More Data-Driven!” Save your seat here!
But First, a Change in Mindset
I would be remiss if I didn’t explain that we made a monumental shift in our mindset as a company several months before we even knew we should look into real-time reporting.
In August of 2016, we officially moved to a scrum-based agile marketing model. I have an entire article that dives into what we did, but the important thing is that we built in an iterative approach to how we plan our marketing.
Before scrum, we built monthly marketing plans that followed this process:
- Start Month B by reviewing Month A’s data on a call with our clients
- Begin planning the Month C’s work around the 15th of Month B -- based on Month A’s data and before Month B’s tactics have made
any impact. - Complete Month B’s work based on Month A’s data, slightly unsure we’re doing the right things.
- Start Month C by reviewing Month B’s data.
- Wash, rinse, repeat - all without real-time data to course correct sooner than later if needed.
As a Strategist at the time, this was extremely frustrating for me. It always felt like our planning was behind and we all knew there had to be a better way.
Then came agile marketing, which opened our minds into how to change our strategic planning cadence and start using data in the moment.
With this came a need for data and a tool that could keep up with this new cadence.
Enter Databox and an Updated Process
Now, we didn’t automatically start using real-time data after the switch. We still went several months creating monthly marketing reports in the form of spreadsheets or Google Slide presentations, depending on the client.
Not only was this severely inefficient (especially since we weren’t even consistent), it was a colossal waste of time.
As we gathered data, we did set time to analyze and learn from it, but it still didn’t feel very agile as it was older data and we were already committed to a month’s worth of work that didn’t take it into account.
Our clients found this frustrating as well, and most didn’t find these reports valuable anyways.
A New Planning & Data Cadence
Fast forward to June 2017 when we found Databox.
It couldn’t have come at a better time for our agency. In Q2 of 2017, we took on an initiative we deemed “The First 100 Days,” which aimed to improve our client experience the first 100 days they are with us and beyond.
Part of this initiative was blowing up the traditional agency model where we planned based on how retainers were set up (i.e. monthly). This never felt quite right and we weren’t truly agile if we forced our clients to commit to an entire month of work with so many variables -- data being the primary one.
So, to end the cycle of planning based on old data, we began managing our client (and internal!) engagements by objectives and key results.
Our planning cadence changed as well:
- 2-3 weeks before the end of the quarter, we now create a roadmap for the next 90 days that outlines the key results we aim to achieve
- 1 week out, we create a marketing plan that outlines the campaigns and tactics we think will hit those key results
- Load everything into our backlog and operate on 2-week sprints to get the work across the finish line (no more monthly plans!!!)
Now you might be thinking, …”You went from monthly planning to quarterly...how is that
Firstly, we were missing the guardrails our marketing plans needed to be effective with our old monthly approach.
We always had goals, but by defining specific objectives and key results within a set timebox of 90 days, we’re able to hyper-focus on what really matters for our clients in regards to those goals during that time.
It’s just the right amount of time to let campaigns work their magic and allow us to see what’s really working and what’s not.
Secondly, although we have a tentative strategy for 90 days, we know very well that what we originally planned at the onset of a quarter may not be the right thing to do, and we and our clients are totally okay with switching things up mid-quarter if need be.
In order to determine if we need to course correct, we reassess our campaigns and performance weekly in real-time -- using Databox.
Data is the first topic in every meeting to give context to our discussions, and to ensure what we discuss is actually going to affect our results.
There are A LOT MORE things we can do with Databox, such as set custom alerts on key metrics we’re monitoring and implementing more of the goals features, but that’s for another post. :)
I do want to note that Databox (like any tool) is not the end all, be all, but it’s the starting point to identify issues and dive into the metrics that matter.
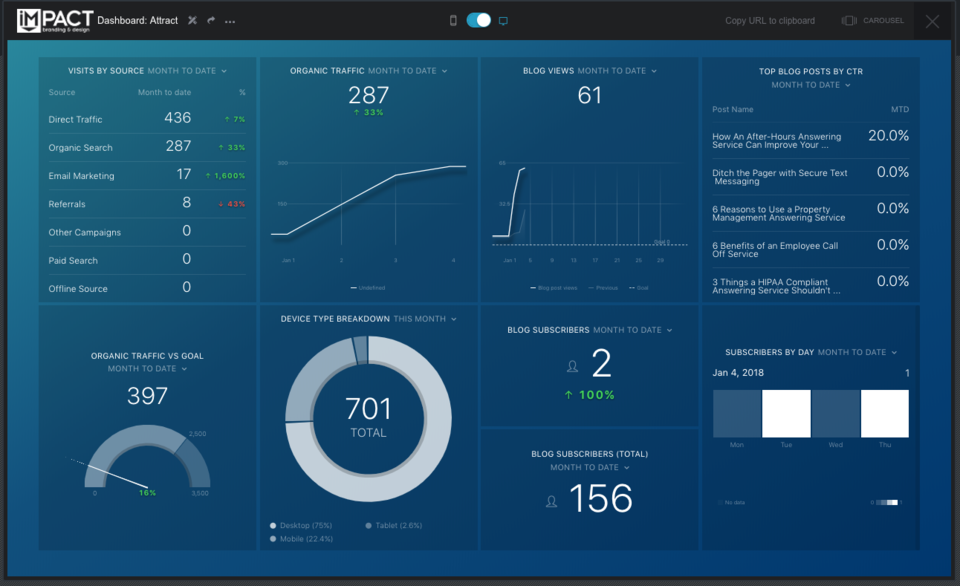
But don’t just take my word for it. See our move to data-driven marketing with Databox in action with the following real-life client examples.
See Databox in Action: 3 Real-Time Data Success Stories
1. Ambs Call Center

"Every meeting, we start by looking at Databox. About six weeks ago, we realized that Ambs organic traffic was trending down month over month. After the second week with no recovery, we dove into Google Search Console and pulled keyword ranking data. What we found comparing the previous months with our current month was that a set of keywords that we were no longer wanting to be found for were losing rank (so, this was actually a good thing!)
We explained to our contact, Aaron, that the dip in traffic was expected based on the de-emphasis we put on a set of keywords and the new emphasis we were creating for a new set of keywords.
After applying some technical SEO changes to the site and to the content, we found that in December, the decline in organic traffic stopped and in January, we're seeing a sharp incline for our new target keyword. The keyword in question rose from position 56 to 10 in 3 weeks.
Had we not been looking at Databox each week, we wouldn't have noticed the trend.
By identifying the trend, we were able to use our tools to tell us what was going on and then apply the right tactics to increase the right kind of traffic.
Needless to say, Aaron, our client is very happy and well, so are we!"
- Britt Schwartz, Principal Strategist
2. SYDCON
“I popped into their dashboard before a meeting and noticed month over month organic traffic was trending down for the first time this month. I looked between months to see what the difference was, which encouraged me to dive into HubSpot to look at a week over week organic search report.
From there, I was able to pinpoint that the drop was due to migrating their blog over to HubSpot. I was able to diagnose the issue and we were able to do some quick technical SEO to correct the issue.
By checking Databox weekly on meetings, we were able to recognize it right away and my client is happy I keep an eye on things for them in real-time. We just made our updates, and our Alexa ranking has already bounced back.”
- Stacy Willis, Senior Strategist
3. United Methodist Homes

After realizing we had the same lead magnet on the blog since we launched, our first idea was to make a change there. We decided to swap it for a recent offer that was different enough from the original lead magnet that we’d be able to attract the visitors who didn’t see value initially.
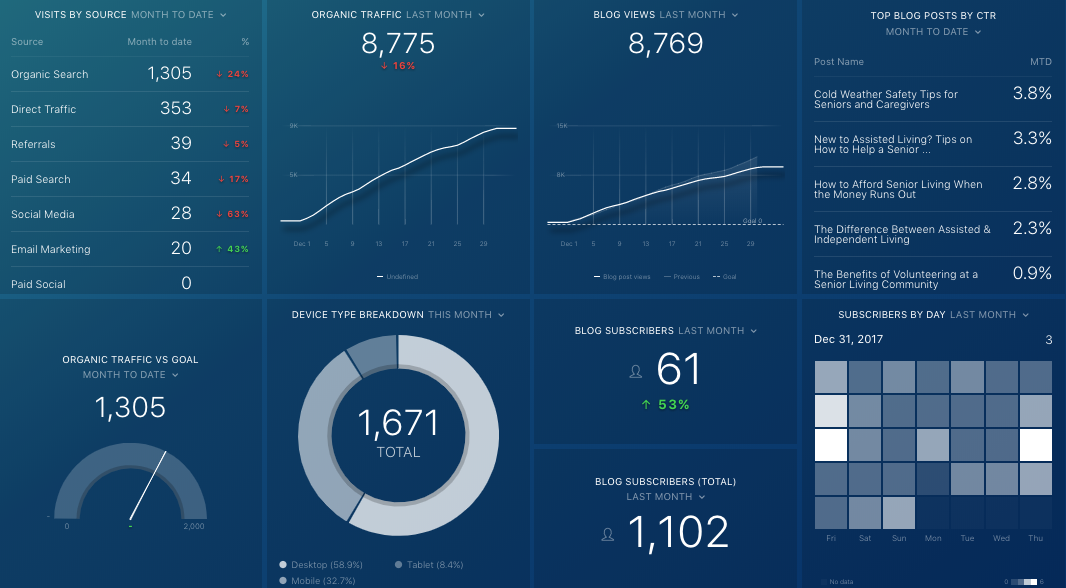
After making the switch, we let it run for a month. When we checked Databox during our first call of the year, we saw had a 53% increase in subscribers for the month of December!
Needless to say, both the client and I were very happy to see that increase during our weekly Databox review. If we weren’t getting real-time insights from it, we may not have been able to identify or correct this issue as quickly”
- Karisa Egan, Strategist
To get the exact same Databox reports we use, check out this post and get them for free!
Get The Full Scoop
We’re doing a full webinar next week that goes into more detail about how we’ve used Databox for our reporting.
In this live 60-minute webinar, Databox CEO, Pete Caputa and I will dive into:
- What KPIs and metrics we measure
- How to build a streamlined, in-house automated reporting process
- The secret to avoiding missing targets using alerts
- How to create a process where every team member can—and does—monitor data and track results
- How to set S.M.A.R.T goals and automatically track progress towards them
- The formulas to create the right marketing dashboards quickly (and monitor the right analytics in real-time)
- And more!
Whether you're interested in the tool itself, or just want to figure out how to report in a more agile way, save your seat to watch here!
Free Assessment:

