
Oct 18, 2018

Are you sure you are tracking the right marketing key performance indicators (KPIs) for your company?
An agency owner recently told me about a mistake one of his prospects, the Director of Marketing for a pasta sauce brand, was making.
The director’s job was to build awareness for the brand, since people do not buy pasta sauce online directly from them.
He had determined that “unique website visitors” was the best KPI for measuring the success of his efforts. He rationalized that if more people visited his website, he would have created greater brand awareness.
But, when this agency owner dug into the metrics, he saw a different story. Sure, the number of unique sessions was higher. But, very few visitors were clicking into multiple pages and they quickly stopped watching the videos on the home page.
In other words, the director of marketing was about to get some bad news – he likely wasn’t growing brand awareness through an increase in website traffic alone.
This agency owner needed a framework to help his client identify the metrics they should measure. I suggested the “Acquisition-Behavior-Outcome” model, created by Avinash Kaushik.
This model can help any digital marketer discover the metrics that will eventually lead to revenue.
In this guide, I will strictly use examples from Google Analytics, since it is nearly ubiquitous in the digital marketing world. But, you could use any marketing or sales tool to track your performance with this model.
What To Do Before You Create Your Google Analytics Report
Before identifying the individual KPIs you want to track, you should first set a SMART goal around your marketing efforts.
For example, if your company goal is to “increase revenue this year”, even $1 more than last year would technically be enough to hit that that goal.
But, if you set a more specific goal, like “increase revenue by 20% by December”, you will find the A-B-O model to be much more useful.
Also, you might find that you can’t hit an ambitious goal by only improving one KPI, like website traffic. Instead, you will need improvement at multiple steps of your funnel in order to achieve your goal.
And even if your digital marketing team is not evaluated on revenue generation, the A-B-O model will help you more closely correlate your marketing activities to your revenue achievement.
For example, if you do digital marketing for an enterprise product, the end goal of your website may be “demo requests” for the sales team which historically close at a specific rate so that the sales team can hit their revenue goal.
Or if you are marketing pasta sauce that’s sold through retailers, you might try correlating increases in website traffic to offline sales in specific regions or through specific retailers.
How To Choose Acquisition Metrics
What actions do people take when they are interested in learning more about your brand?
Acquisition metrics will help you understand how many people have expressed enough curiosity to click a button to learn more.
That could mean that a potential buyer saw one of your pages on a Search Engine Results Page (SERP) on Google, and clicked it to read more.
Or, the person viewed one of your videos on YouTube.
Or, the person clicked on one of your Facebook Ads.
These are ways to track how potential buyers learn about your brand in the first place.
But, you probably also want to look at the cost of each channel, especially if you are running marketing campaigns on multiple platforms (ex. your blog, Facebook Ads and YouTube).
If it costs you $5,000 to make a video, what is the ROI of that spend? How does that compare to spending $3 per click on Facebook Ads?
To compare marketing channels effectively, at a minimum, you need to track traffic to your website from every channel using something like the Google Analytics Acquisition dashboard below.
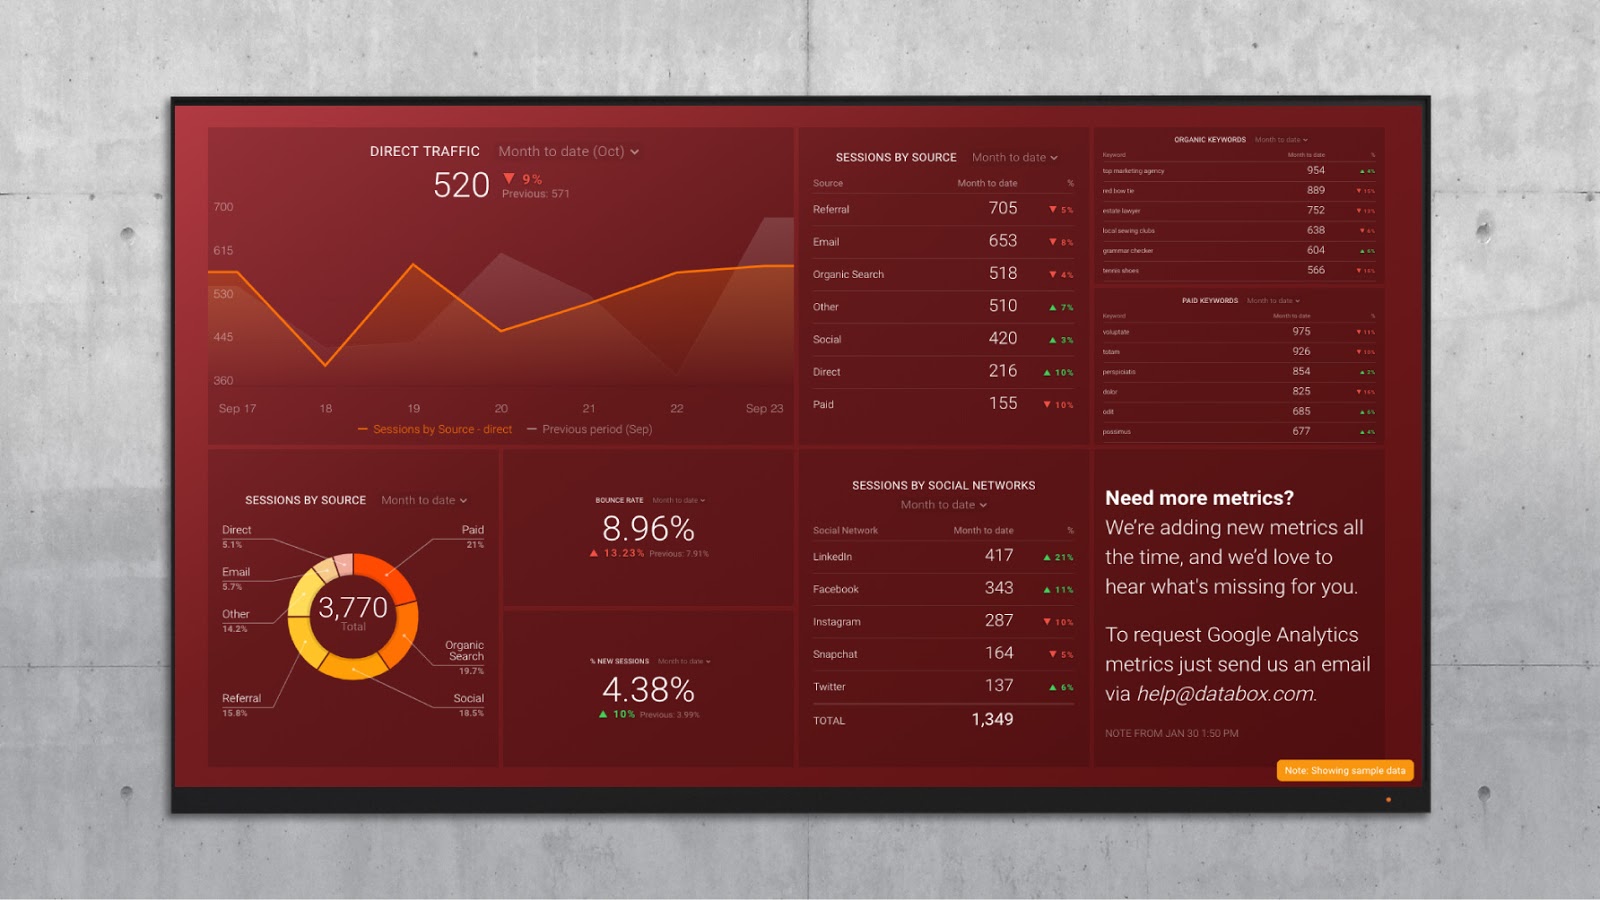
Within these acquisition channels, you should probably also dig into the individual factors that make each channel successful.
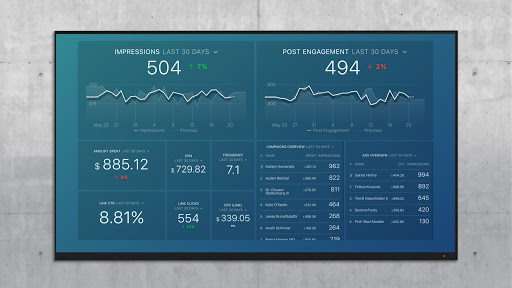
For example, if you are running Facebook Ads:
- Which ad formats have worked best?
- Which audiences have been receptive?
A Facebook Ads dashboard like the one below can help with that:
How To Choose Behavior Metrics
After you’ve chosen some acquisition metrics, you should choose metrics that determine whether or not your audience is behaving in a way that demonstrates they’re finding what they want or need.
This is where the pasta sauce brand manager went wrong.
Ask yourself, “What do you want people to do when they are exploring your website, watching your video or viewing your ad?”
Behavioral metrics teach you about the actions that people take after they discover you.
For example, if you create YouTube videos, you may want to know the percentage of viewers that watched 50%, 75%, and 100% of your video.
If you’re blogging, you may want to know how long people spend on each page, the number of total pages they view, and whether or not they convert to a lead.
If you run Facebook Ads, you may want to use a tool like Lucky Orange or Hotjar to see whether visitors are reading your landing page after they click your ad.
Here’s the thing- these three interactions are rarely a linear sequence of events a prospect takes. In other words, visitors do not click on your Facebook ad, read a blog post on your site, watch a video to completion and immediately fill out a form or buy your product.
They may buy immediately if they have been looking for your product for a long time and have finally found you. But, more often than not, they will come back and explore your site a few times, ask a friend about you, find you in a completely different way, then buy.
That’s where KPIs, or Key Performance Indicators, come in handy.
If a website visitor is clicking into multiple pages and watching a few videos, they still might not be interested in buying immediately. But, when lots of visitors read multiple pages and watch multiple videos, a higher percentage of them will take your desired action. And by improving the right “behavior” KPIs, you can improve your overall results.
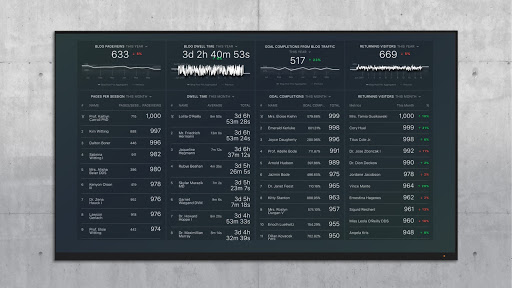
One good example of a behavior-focused dashboard is the “Blog Quality Metrics” dashboard. It looks at the behavior of website visitors by blog post including pages per session, dwell time, goal completions and % of visitors returning. Using it, you can identify the topics that lead to engaged visitors so you can write more about those topics, the posts that are performing well that you should promote more or the posts that aren’t performing well that you should optimize further.
How To Choose Outcome Metrics
Outcome metrics should answer the question, “How are my website and marketing activities driving results for my business?”
Although your website should be a good resource for people to learn about your brand and the problems you solve, you will also want a way for visitors to take the next step towards becoming a customer.
- If visitors come to your website via Facebook Ads, you may want them to fill out a form on a landing page.
- If they watch all your content on YouTube, you may want them to try some of your content that is behind a paywall.
- If they find your website via Google, you may want them to book a demo or sign up for your newsletter.
- If you sell pasta sauce through retailers, you might want them to use your store locator or download a recipe.
In all of these scenarios, you can use multiple metrics. This is especially important for a growing marketing team, since you may want to evaluate different team members and different marketing activities using different metrics.
Just don’t make your team members too siloed. They should all have an understanding of the A-B-O framework so that they do not get fixated on just their part.
For example, let’s say your marketing team uses both website sessions and “demos” booked as separate KPIs. They should understand the connection between the two so they write content that drives traffic and conversions. If one of your team members just focuses their energy on sessions, you may find that you have a website with plenty of traffic, but few conversions.
How To Track All Your Google Analytics Metrics
After you choose a few acquisition, behavior and outcome metrics, set up some internal processes to make sure that everyone can easily monitor all of the data.
Some organizations choose to copy and paste data into a spreadsheet on a weekly or monthly basis for review. Others use an automated dashboard to automatically pull data in real-time from tools like Google Analytics, Facebook ads, HubSpot and/or Salesforce.
Regardless of your preferred method, the A-B-O framework will help you make decisions when you need to adjust your marketing strategy in order to hit a monthly, quarterly or annual goal.
For example, let’s say that demo bookings are down for the month. That could be happening due to a lack of traffic, low engagement from visitors, or poor conversion rates on landing pages.
The A-B-O framework will help you investigate all three, so that you don’t just default to generating more and more traffic to hit your demo booking goal, which may be a lot harder.
If you are looking for some inspiration on how to set up your Google Analytics reports, check out these 10 free Google Analytics dashboards that have helped over 500,000 people. They will give you some ideas for metrics that you can use for your business.
You could even build a dashboard that includes metrics from all 3 steps in the A-B-O framework, like the one below:
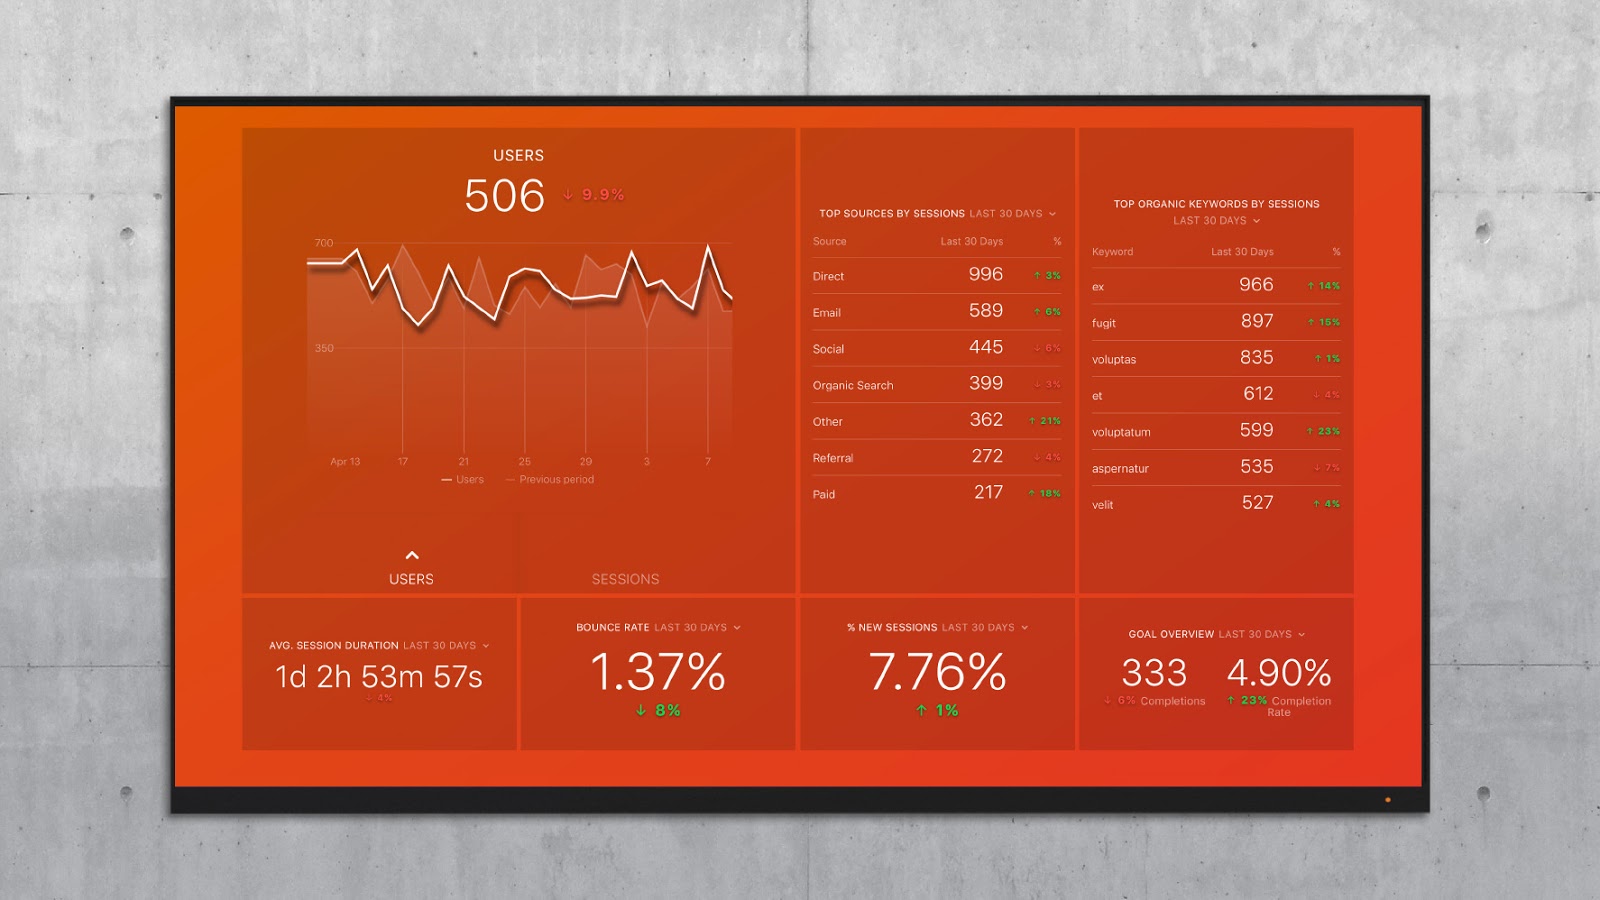
For the director of marketing at the pasta sauce brand, a dashboard like this and some attention paid to a few more KPIs, would have ensured he actually improved brand awareness.
Make sure you don’t make the same mistake he did.
Anyone else hungry right now? If you’ve read this far, you’ve earned yourself a big bowl of pasta.
Mangia tutti!!
Order Your Copy of Marcus Sheridan's New Book — Endless Customers!
/Assets/Icon%20Library/x%20corp.svg)
/Assets/Icon%20Library/whatsapp%20logo.svg)
/Assets/Icon%20Library/Email.svg)
/Assets/Icon%20Library/Arrows/Grey%20Arrow%20-%20Prev.svg)
/Assets/Icon%20Library/Arrows/Grey%20Arrow%20-%20Next.svg)