

Website performance metrics
- Website traffic
- Technical SEO health
- Site Authority Score
- Visibility Index
- Behavior analytics and user feedback
- Video plays and percentage watched
- Leads
- Goal completions
How well does your website perform? How hard does it work for your company? Do you know?
You absolutely should.
Great websites that convert leads to sales require a serious investment, both time and money, and you need to know what your return is on that investment. If not, you might as well stack your web money in a neat pile, douse it with gasoline, and set that sucker on fire.
Sound dramatic (or maybe hilarious if Liz Moorehead is attempting it)? It really isn’t.
Consider it this way: Imagine your website is a member of your sales team. Would they have specific, measurable, and time-bound sales numbers they need to hit, or would you give them a pat on the back, and say, “Just try your best, Champ!”
Of course not. You would give them sales goals to hit.
And if Champ failed to hit those numbers quarter after quarter? Would you address their poor performance, or just continue signing their significant paycheck without a second thought?
Yeah, you’d address it.
That’s why it’s important to set your monthly website performance metrics and stay on top of monitoring them.
What website performance metrics should I track every month?
Measuring the success of your site isn’t about getting feedback from your customers about how nice your headshots look on the About Us page. While that might validate your new haircut and make you feel good, it’s not going to convert leads to sales.
You should keep track of specific website performance metrics via monthly reporting that directly correlate to your bottom line goals.
You don’t want to look at the data every single day because you’ll drive yourself insane. Website performance metrics across the board will vary from day to day based on random variability, so zooming in that closely won’t allow you to see meaningful patterns emerge.
On the other hand, reviewing metrics once a quarter or even once a year can zoom you out too far. You want to be agile enough to see trends in the data and react to them quickly. In some instances, it might be a matter of seeing that a particular campaign is performing extremely well and you should throw more resources at it. It could also mean staying on top of technical SEO so that issues don’t pile up month after month, negatively affecting your search engine rankings.
Here’s what you need to look at.
1. Website traffic
Broadly, website traffic is about the users who come to your site. You need to measure the amount and quality of that traffic, as well as what users are doing on your site.
Understanding your traffic is crucial because more eyeballs on the site mean more potential sales. Each site visit is an opportunity to make a great impression and help people along their journey to getting their problems solved with your business as their guide.
Here are some important site traffic metrics to note.
Sessions: Google defines a session as “a group of user interactions with your website that takes place within a given time frame.” One session can contain multiple page views, events, and even e-commerce transactions.
As you consider session data, ask yourself: Are site sessions going up or down? Are there marketing efforts (or lack thereof) that you can tie trends to? Are there seasonal factors that may be spurring trends (e.g., an uptick at Christmas for an e-commerce site)?
Channel, source, and medium: Channels are the bigger buckets your site traffic comes from (direct, organic, social, email, referral, paid, display, other advertising). Source and medium drill down into the details. For example, within your paid traffic channel you can have facebook.com as a source and pay-per-click (PPC) as the medium.
Knowing where your traffic comes from helps evaluate factors that affect site effectiveness, such as SEO performance. Not getting the organic traffic you want? Make sure your site and blog content is optimized.
🔎 Related: Is SEO Dead in 2020? A Comprehensive & Tactical Analysis for Digital Marketers
New vs. returning visitors: New visitors are great for feeding the funnel, but returning visitors? They bounce less, view more pages per session, have longer sessions, and convert at a higher rate.
If you’re not increasing the number of returning visitors, you have a content problem. Your content needs to be published at a high quality to get people to keep coming back to the site.
Landing pages: These pages are the entry points to your website from particular sources. Looking at what pages people come to from organic sources tells you how good (or bad) your SEO is. Landing pages from email sources give a clue about what your subscribers are interested in. Are people going where you are directing them?
Time on page: Looking at time spent on specific pages can tell you whether users are reading the copy you’ve written, interacting with dynamic elements, watching videos, and having a good experience on the site. Low time on page tells you you’re losing them and need to optimize.
Pages per visit: More pages per visit means more interest, which means a higher chance for conversion.
Bounce rate: Different types of pages should have different bounce rates. For example, your Contact Us page might have a higher bounce rate because people are typically submitting the contact form and then leaving your site.
But, in general, Semrush notes that a bounce rate of 56% to 70% is considered high (depending on where the page is in your funnel) and a bounce rate of 41% to 55% is average.
2. Technical SEO health
When I talk about SEO, it’s not uncommon for marketers to think I’m referring to having blog posts optimized with keywords for search engines.
But technical SEO is a much bigger and uglier animal. It’s important to wrap your arms around it because the healthier your technical SEO, the higher value search engines will give your site, and the better your site will rank.
It includes:
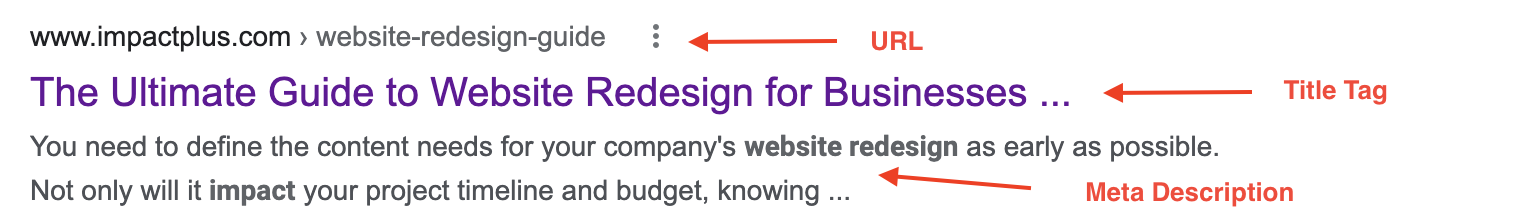
Title tags, meta descriptions, and alt text for images: All of these pieces of a webpage help search engines understand what the page is about.
Backlinks: Internal links created when another site links to yours. More on this later.
Structured data: A standardized format to mark up information on a page so search engines can better understand what they’re about.
Crawling: Search engines looking for content on the internet and looking over the code/content they find for each URL.
Indexing: Search engines storing the information they find during a crawl. If your pages aren’t indexed, they won’t rank in search engine results pages.
🔎 Related: Google Index: How long does indexing take and 11 ways to get your pages listed faster
Rendering: When bots run your site’s code and assess your content to understand your site structure. The assessment informs how your site is ranked compared to others.
Mobile: How well your is site optimized for use on mobile devices is a critical factor in user experience.
Site structure: This includes navigation, internal linking, and URL structure. A site’s information architecture must be clear to users and to search engines.
Status codes: When you visit a site, your browser sends a request to the server and the server responds with a code. 1XX, 2XX and 3XX (redirection) codes are fine. 4XX (pages not found), and 5XX (server) errors can cause problems and need to be corrected.
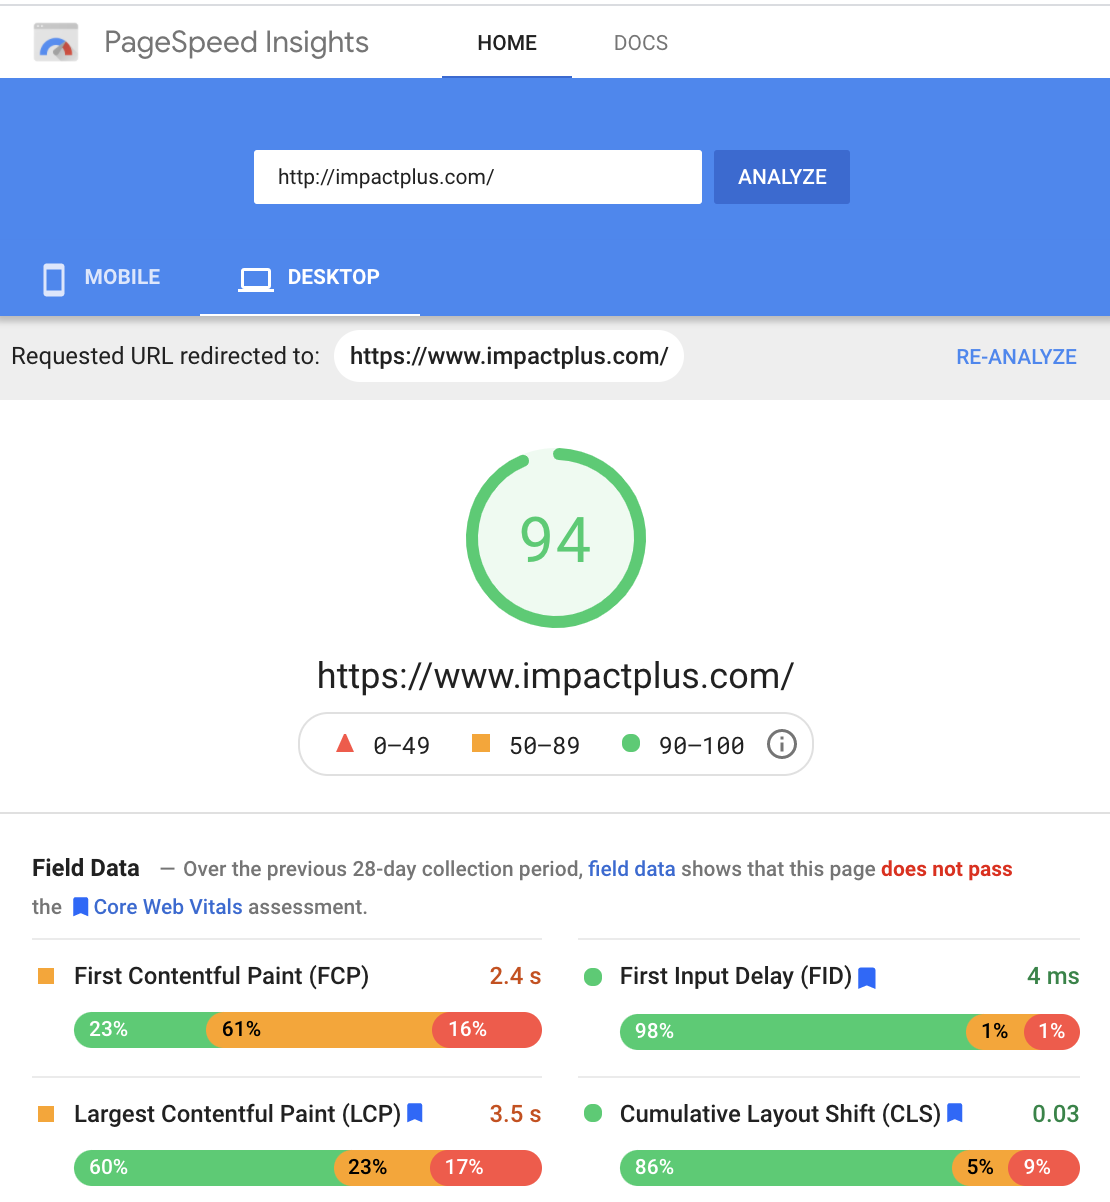
Page speed: How fast the content on your site loads—faster being better, of course. Free tools, such as Google PageSpeed Insights, will give your site a score and provide optimization opportunities.
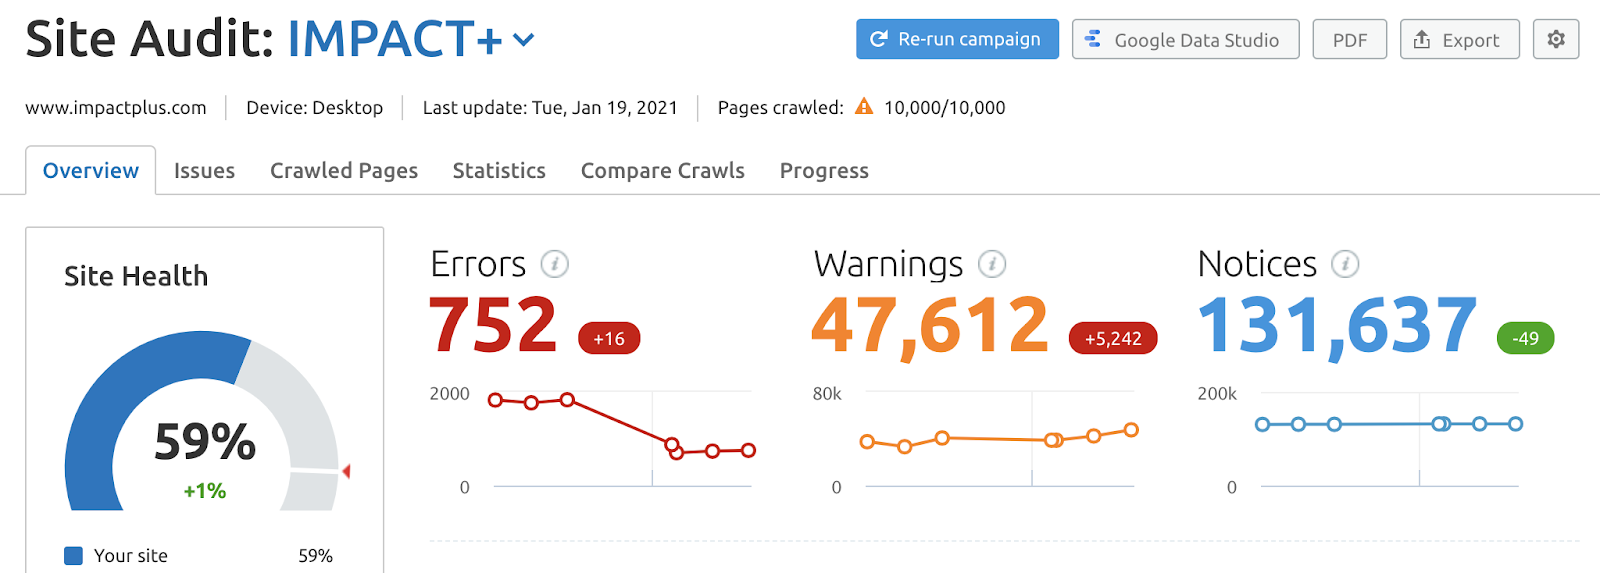
If it feels like that’s a lot to wrap your head around, it’s because it is. Luckily, there are tools out there, such as Screaming Frog and Semrush, that marketers can use to audit their site’s technical SEO health.
Some fixes, such as making sure each page has a unique title tag and meta description, are simple enough for a marketing intern to handle. Others, such as DNS resolution issues, might require development help.
The better your site's health, the better your site will rank in search engine results. That’s why it’s critical to make the time, even if it’s just five hours per month, to review your site’s technical SEO and resolve as many issues as you can.
3. Site Authority Score
Site Authority or Domain Authority is a score that predicts how well a site will rank in search engine rankings.
Semrush describes Authority Score as “our compound domain score that grades the overall quality of a website. The higher the score, the more assumed weight a domain’s or webpage’s backlinks could have.” Scores live on a 0 to 100 scale.
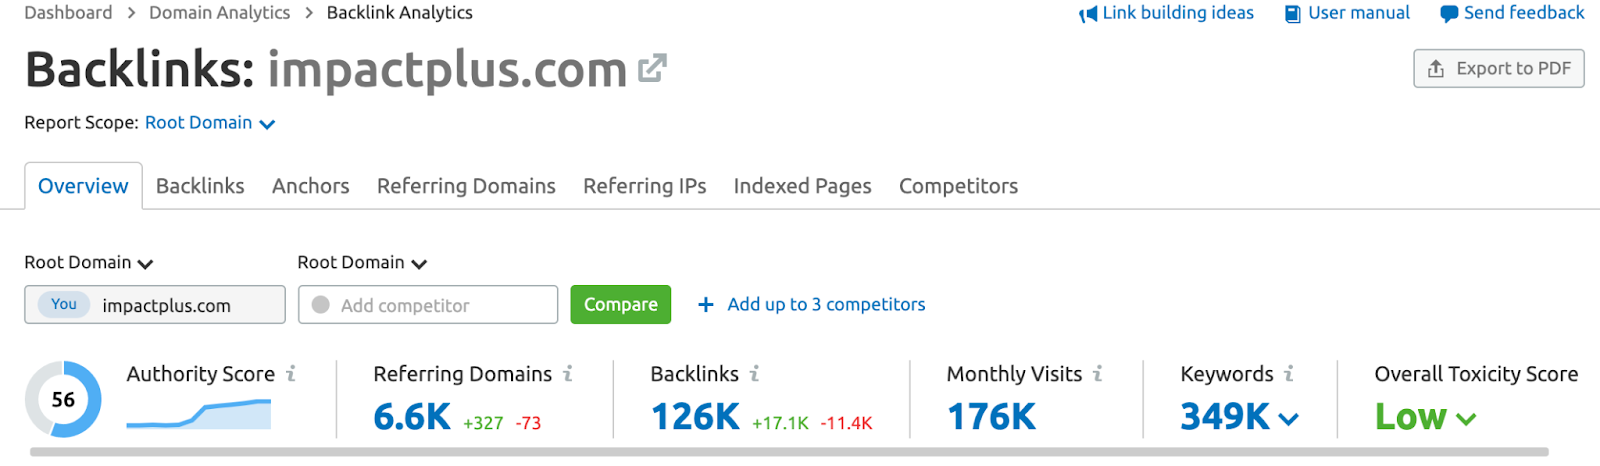
Semrush uses organic search data, website traffic data, and backlink data to understand the rankings of popular and trusted domains. It also uses backlink data to see how gaining links can make site authority increase or decrease.
🔎 Related: What Is Backlinking & How Does It Help Marketers?
You can use Authority Score to judge how well your link-building efforts are paying off. Having a ton of internal links isn’t enough – the links have to be of good quality to positively impact your site’s score. You can also look at what your competitors are doing to see if you need to step up your game.
Your Site Authority score can also be affected by toxic backlinks, which are internal links from untrustworthy sites. Checking for toxic backlinks on a regular basis will ensure your site’s Authority Score isn’t getting dinged.
🔎 Related: How to Disavow Links for Google or Bing that are Killing Your SEO
4. Visibility index
Semrush’s Visibility index (I swear I’m not trying to sell you Semrush; it’s just a great tool) tells you how often your site is being found online: “A zero-percent visibility means that the domain isn’t ranking in Google’s top 100 results for any of these keywords, and a 100-percent visibility means that the domain keeps the first position in the SERP for all of these keywords.”
Increasing visibility in search engine results gives you a better chance to get new eyes on your site. If you’ve been working your tail off on SEO or a PPC campaign, visibility percentage is a great way to measure performance.
5. Behavior analytics and user feedback
Behavior analytics tools, such as Hotjar, Lucky Orange, and Crazy Egg collect data based on user interactions with your website. This is extremely important because, though Google Analytics can present you with a ton of data about how people are using your site, the picture is incomplete without knowing why users are doing what they’re doing. For example, you might see that the bounce rate is high on a particular page. Behavior analytics tools can fill in the gaps.
Each tool has its own quirks, but they have some really cool features in common. ...
Heatmaps visually help you understand what users are doing on your site. You can look at scrolls, moves, and clicks.
In the image below, blue shows light interaction, yellow is heavier, and red is heavy interaction.
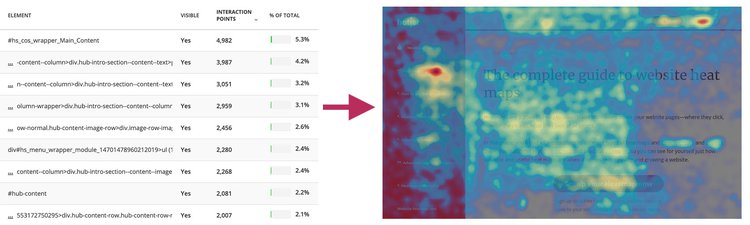
A map like this can show you what users are most interested in, what they’re ignoring, what they’re not even seeing, and the things they think are clickable that aren’t.
Recordings take the guesswork out of how people are using your site. You can spend as much time as is logged watching site visits.
Are the user paths you outlined when developing your website the ones people are really taking? Are visitors clicking on a page, scrolling to the bottom, scrolling back up, pausing for a moment or two, trying a different page, then bouncing? Are they engaging with the dynamic elements you’ve added to the site or ignoring them?
I’ll warn you, sometimes you’ll watch a recording and find yourself yelling, “NO! Why did you do that?!” at the screen when you watch a user do something totally weird. Or maybe that’s just me.
Elements breaks down clicks into buckets and ranks the buckets by popularity. Instead of showing the precise click interactions (e.g., every random click in white space that doesn’t go anywhere), it will tell you which links and buttons were most often clicked on. This is great for determining where people want to go next when they’re on a particular page.
Regularly reviewing user interactions gives you fantastic insight into how people are actually using your website. Wouldn’t you rather make updates knowing exactly what people want?
6. Video plays and percentage watched
Producing high-quality video for a website isn’t cheap. I’m not talking about the iPhone videos you’re putting on Instagram. I’m talking about your product or service videos and your pricing videos that are doing the heavy sales lift.
You wrote scripts, took time out of your schedule to rehearse and film, whitened your teeth, ironed your clothes for the first time in a year, and hired a production studio.
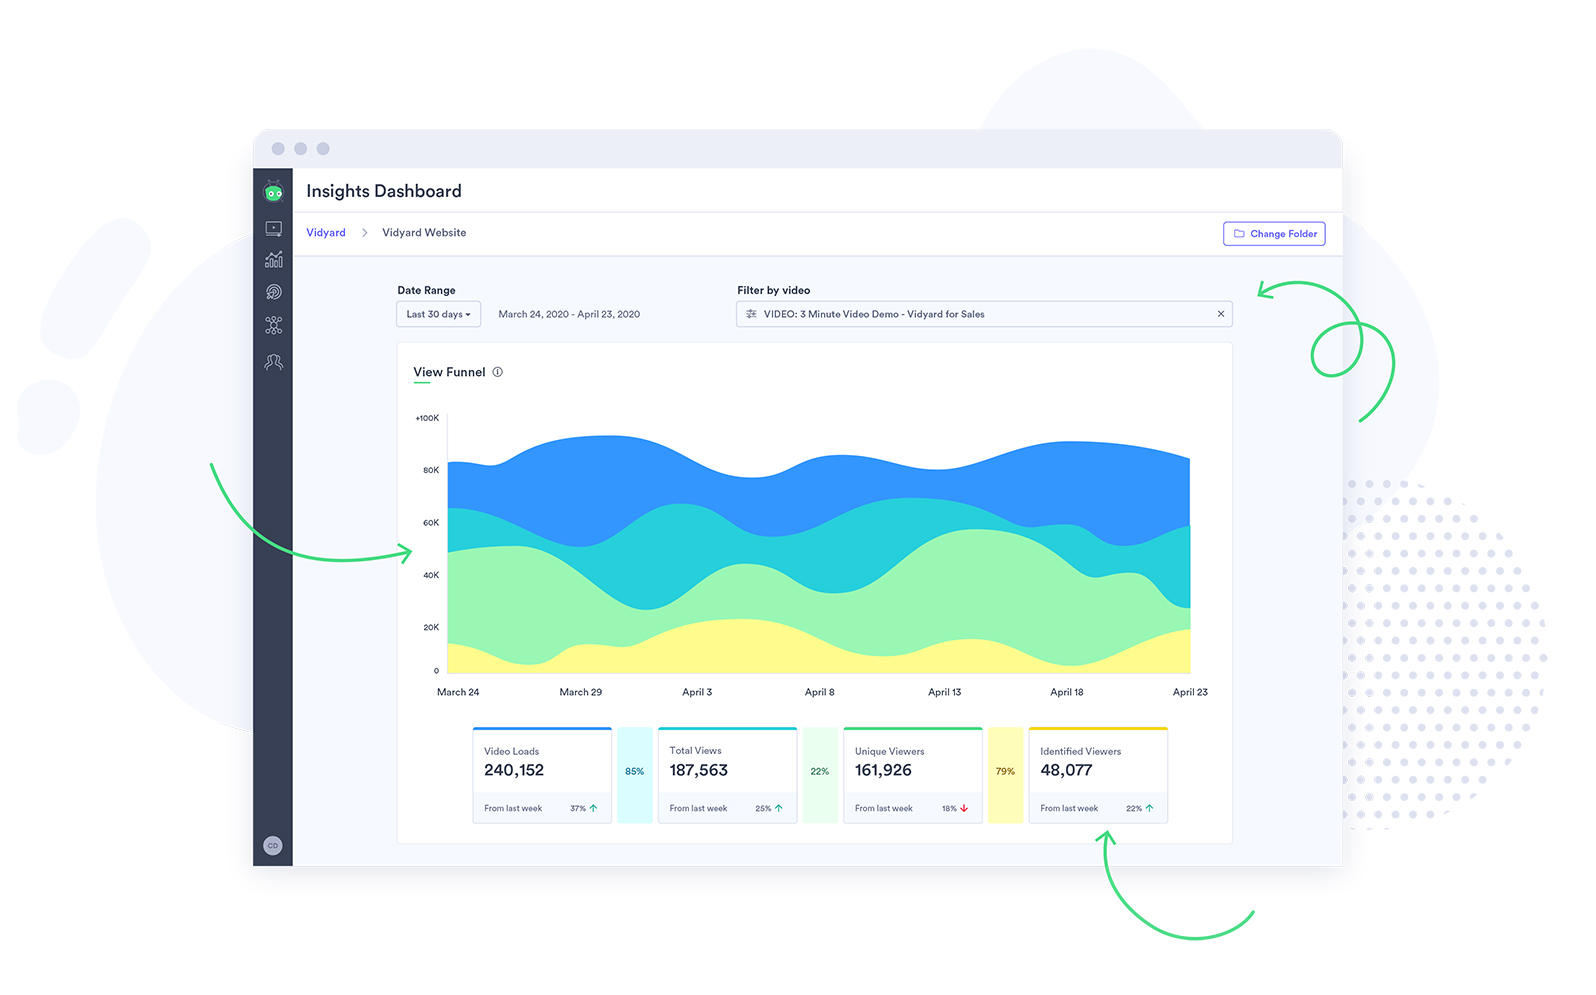
Your video hosting platform needs to provide analytics the same way your CMS does.
Tools such as Vidyard can provide that data. In the analytics dashboards you can see:
- The number of people watching your videos.
- Who, specifically, is watching them.
- What percentage of the videos (how long) they watched.
Measuring these video metrics fills out the picture painted by basic page analytics. For example, let’s say someone comes to your site, views three pages, then leaves. Not a very inspiring visit, right?
What if the three pages they visited all had videos on them and that site visitor actually spent over 45 minutes watching a webinar, a customer testimonial, and a product demo? When you factor in the video time, the quality of that visit is much higher and that prospect is much more valuable. This is exactly why video analytics are so important to understanding overall web performance.
7. Leads
CRM systems contain a treasure trove of data about your company’s subscribers, lead opportunities, leads, customers, and evangelists. Is your CRM connected to your website? I certainly hope so. If not, you’re losing out on critical information about how well (or not) your website is converting contacts to evangelists.
Every month you should be looking at where your contacts are coming from and how they’re engaging with your site. Specifically, you should look at:
- Number of leads: How many leads is your site generating? This metric alone is not enough to judge site performance. For example, if you get a ton of leads but they’re all junk and don’t convert, that’s a problem.
- Lead quality: You can judge this based on things such as the ratio of leads to opportunities, the percentage of leads who become converted customers, and time to conversion.
- Leads by source: Where are your leads coming from? Are you getting a ton of organic traffic from the blog posts you’re writing but the traffic isn’t converting? You’ll want to provide opportunities for readers to dig deeper into your content, such as image CTAs in your posts that highlight related high-value downloads.
- Lead conversion rate: If conversion rate for conversion content is low, you’ll want to find ways to optimize it. If the conversion rate is high, you’ll want to drive more traffic to it. You can also work backward from your customer records to see how much and what kind of site content they engaged with on their buyer’s journey. You might see patterns emerge. For example, a majority of your customers might view at least 20 pages on the site before making a purchase.
- Customer acquisition cost (CAC): Every customer comes at a price, whether you’re investing money in ads or time producing a webinar. If you’re spending $150,000 on advertising for $20,000 in sales, you’ll want to adjust your tactics.
- Lead value: This is usually based on monthly recurring revenue (MRR) or customer lifetime value (LTV). These metrics will help you understand how valuable your average lead is in relation to what you’re spending on acquisition.
Before tools such as HubSpot existed, it was extremely difficult for marketers to show how their web efforts led to sales. Now it’s easier than ever to show ROI and tie your website optimization work directly to revenue.
8. Goal completions
You might be wondering why I’m highlighting goal completions instead of form submissions. Though it’s critical to track form submissions to understand conversions, it’s only one type of valuable action users can take on your site.
In Google Analytics, you can set up goals that monitor a broad range of actions, such as a user spending five or more minutes on your site, viewing five or more pages on your site, clicking a link to a partner page, or clicking an “Add to Cart” CTA.
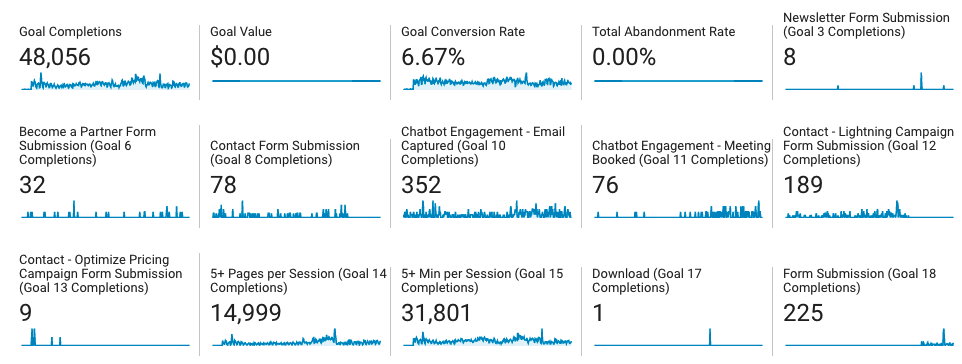
Some, but not all, of these actions can be tracked in your marketing automation software, so using Google Analytics is a great way to round out your data.
Site authority, visibility, traffic, technical SEO, video stats, and behavior analytics tell you what people can and are doing on your site. Goal completions measure whether site visitors are doing what you need them to do or not. Very simply, is your site accomplishing your business objectives or not?
Great web performance takes work
Combining data from Google Analytics, SEO tools, your marketing and sales software, video platforms, and behavior analytics tools will give you a holistic view of your website’s performance. It’s not a small job, but it’s an important one.
One of the best ways to get started is to perform audits and create a deck of benchmark data that includes the areas included in this post. You could start with one slide per area and see where the data takes you. A traffic slide, for example, could include several of the metrics noted within a single table. Within the benchmarks, you can identify areas for improvement you want to focus on. Or you might find you don’t even have the right tool stack!
But once you get started with the right combination of tools, you’ll end up with a long list of improvements that you can then prioritize and tackle in phases.
Your website is supposed to be your hardest-working salesperson. As with any employee, you need to evaluate its performance to see if it’s contributing positively to your company’s bottom line.
The good news? If your site stinks, you can always fix it.
Free: Assessment
/Assets/Icon%20Library/x%20corp.svg)
/Assets/Icon%20Library/whatsapp%20logo.svg)
/Assets/Icon%20Library/Email.svg)
/Assets/Icon%20Library/Arrows/Grey%20Arrow%20-%20Prev.svg)
/Assets/Icon%20Library/Arrows/Grey%20Arrow%20-%20Next.svg)