/Assets/base/Navigation%20Icons/TAYA.svg)
/Assets/base/Navigation%20Icons/Sales.svg)
/Assets/base/Navigation%20Icons/Web%20design.svg)
/Assets/base/Navigation%20Icons/HubSpot.svg)
/Assets/Icon%20Library/AI%20Mastery.svg)
/Assets/Icon%20Library/Learning%20Center%20Laptop.svg)


 Want to know what my greatest fear is?
No one showing up.
To my speaking engagements. To the parties I plan. To the middle school dance I asked that cool girl in the Pearl Jam shirt to.
I’m not sure where this stems from, as I can’t remember ever being “left at the altar” in any one of these scenarios.
This also applies to the blog posts I write, exacerbated by the fact that I can’t even see the intended audience I'm writing for.
(Granted, I see the metrics of how many people viewed the post. But what I really mean is, how much of the post do people actually see?)
As marketers, this is critically important. We spend so much time creating calls-to-action, strategizing their placement on the page, and tinkering with button text, that it’d be a shame if no one actually saw it.
Eyeballs matter. But the sightline of said eyeballs matters even more.
So...how much of your blog post do readers see?
How can we measure this?
In 2006, serial entrepreneur Neil Patel and his friend and business partner, Hiten Shah, launched Crazy Egg.
The tool allowed people to measure user engagement on their websites in a way that wasn’t previously possible. It was really the first of its kind.
"Funny enough, at that time there wasn’t really product/market fit,” Patel told me in August. "I’m not saying that it didn’t exist, but we didn’t know it at least."
Using heat map and scroll map reports, Crazy Egg gave users the intelligence they needed to see exactly how people were engaging with their site pages.
This is what we use.
(Update: The awesome folks over at CrazyEgg were kind enough to offer all IMPACT readers a free 60-day trial. So...Enjoy!)
It’s pretty easy to get a handle on, too. Once you create an account – or start a free trial – it’s easy to add a new snapshot. Basically this means adding a new page to be measured over a period of time specified by you.

Next, you’ll enter the URL of the page you wish to measure.

Last, you’ll choose the duration of the campaign. When it starts. When it ends.

Once you’ve uploaded the desired pages, in this case blog posts, you’ll want to leave sufficient time to gather a large enough sample size in order to draw accurate conclusions.
What can we learn?
In order to fully optimize your blog posts for conversions, you have to know where people are looking.
Obviously you wouldn’t want to waste valuable calls-to-action in places with minimal engagement, right?
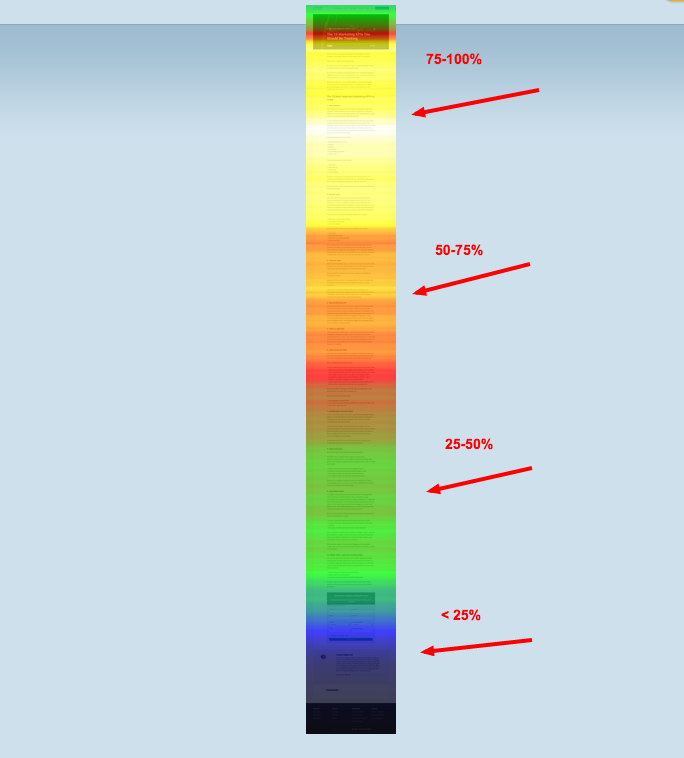
So let’s check out one of IMPACT’s most viewed post of all time, 10 Marketing KPIs You Should Be Tracking.
The reason I chose to highlight this post is because of its popularity.
It ranks third on the first page of Google search results. (Google it!)
It has close to 100,000 views.
It’s earned tons of inbound links.
Still, this tells us nothing about reader engagement. As you can see, less than 25% of people even make it to the bottom of the post CTA, meaning our opportunity to generate conversions drops significantly the further down the post our CTA is.
No matter the popularity of the post, it wouldn’t mean a thing for our conversions if we ignored reader engagement. This is why we employed slide-in CTAs in order to get the attention of readers far earlier in the post, say, where 50-75% of readers actually see. (At this stage of the post, you've probably noticed it yourself.)
And for those who aren’t already subscribed to our blog, we include a banner CTA along the top of the page where 100% of the visitors see.
We optimize for the entire blog post.
Just because you have a CTA included below your blog post doesn’t mean that it’s optimized for conversions.
Let’s take a look at another post. A more recent one.

How to Write Ridiculously Persuasive Landing Pages is one of our best performing blog posts this year. (And it was published this month!)
Once again, popularity is no indication of user engagement. In fact, because this was a longer post, fewer people made it to the bottom than our previous example.
This makes the slide-in CTA even more important, as if we’re not capitalizing on our best performing content, our strategy would have major holes in it.
What else can we learn?
Eyeballs are powerful, but only as powerful as the trigger finger. Or in this case, the mouse-clicking finger.
As we just learned, there is a lot to be taken from where people are actually looking on your blog posts. But what about where they’re clicking?
Check out a close up of the heat map of our popular marketing KPIs post. The brighter the spot, the more clicks that specific area receives.
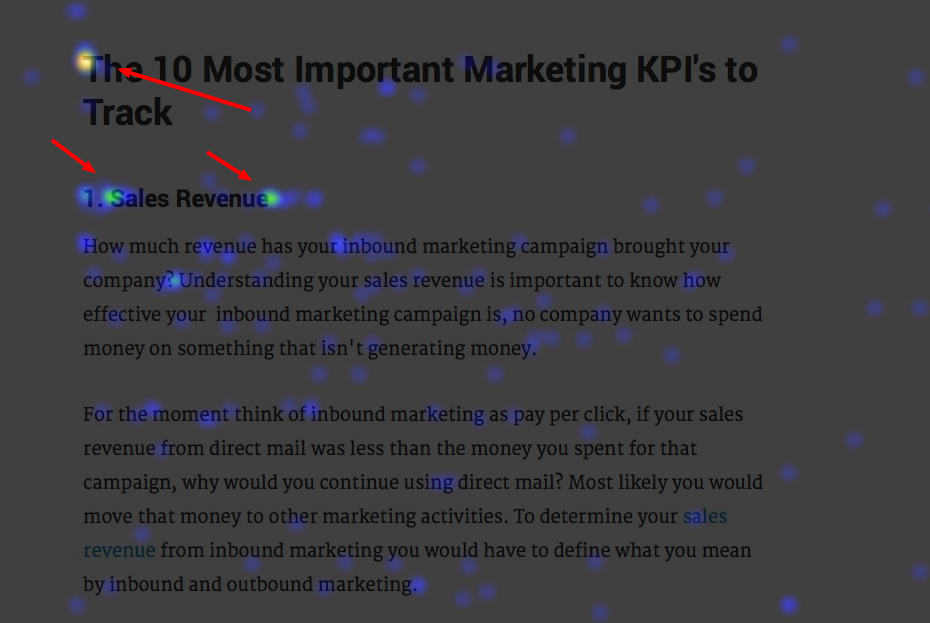
See anything curious?
I do. It looks like we’re getting a ton of clicks on our section headers. Interesting. But here’s the thing, our section headers aren’t linking to anything.
We’re missing tremendous opportunities to drive people to more content on the subject matter they find interesting. In this case, more content on marketing KPIs (section header) and content on sales revenue (section subheader).
But is this just a aberration? Well, let’s take a look further down the page.
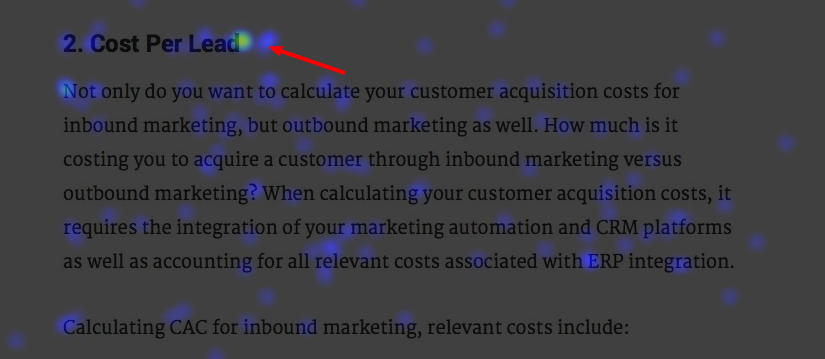
Here it is again. It looks like this subheader gets a ton of clicks too. And once again, it’s another missed opportunity to lead readers to more helpful content.
So does this remain consistent throughout the post?

Yup.
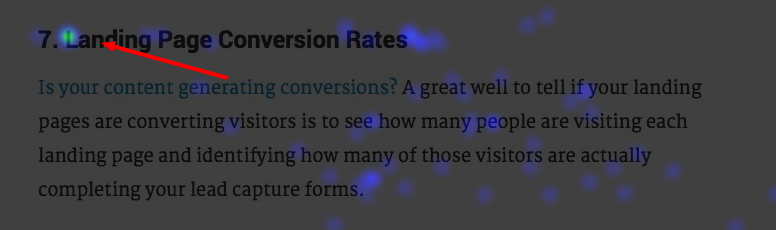
Looks like it does.
Obviously every post is different. To assume that engagement occurs within a vacuum would be as silly as assuming everyone is reading or viewing your post in its entirety,
The important thing is having the tools and process in place for measuring these things.
Because views don’t mean conversions. Behaviors do, and that’s what we need to optimize for.
Free Assessment:
/Assets/Icon%20Library/x%20corp.svg)
/Assets/Icon%20Library/whatsapp%20logo.svg)
/Assets/Icon%20Library/Email.svg)
/Assets/Icon%20Library/Arrows/Grey%20Arrow%20-%20Prev.svg)
/Assets/Icon%20Library/Arrows/Grey%20Arrow%20-%20Next.svg)