/Assets/base/Navigation%20Icons/TAYA.svg)
/Assets/base/Navigation%20Icons/Sales.svg)
/Assets/base/Navigation%20Icons/Web%20design.svg)
/Assets/base/Navigation%20Icons/HubSpot.svg)
/Assets/Icon%20Library/AI%20Mastery.svg)
/Assets/Icon%20Library/Learning%20Center%20Laptop.svg)


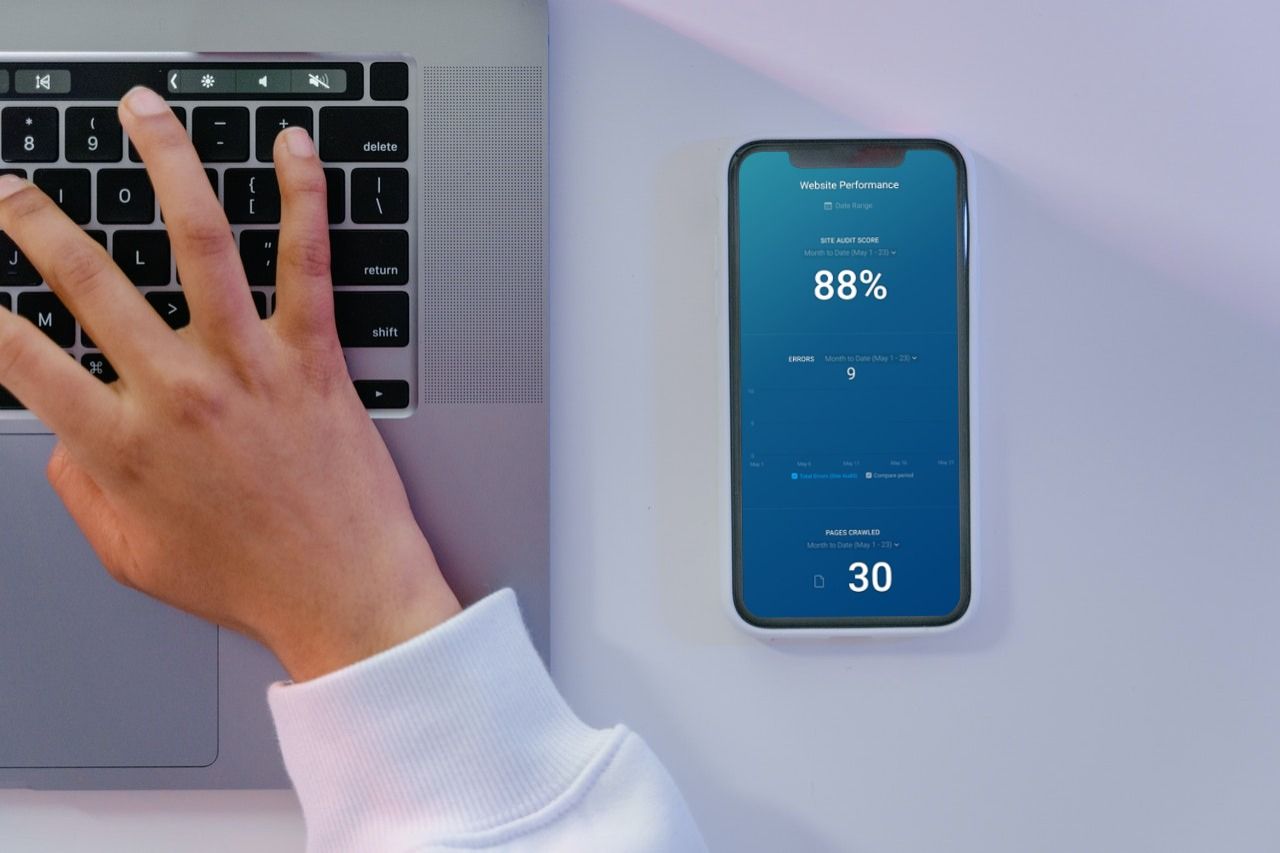
In today’s digital world, businesses are at no shortage of data and information.
From our social media and websites to our customer service and sales numbers, there are dozens of data points to not only collect and consider, but to organize, monitor, and make sense of.
It can be overwhelming and intimidating, especially for an already busy team. Trust me, data and analysis are still things I am struggling with, 10 ten years into my career — but thankfully, there are a number of analytics tools on the market to help you and me alike.
(Editor's Note: IMPACT may receive a small commission if you sign up for these services, but this has not impacted our analysis in any way.)
Two of the most popular options are Databox and Geckoboard.
Both claim to allow you to easily pull multiple data sources into one hub and share your performance results, so which should you choose? In this article, we’ll take a detailed look at their differences and similarities to help you make the right decision for your business and team. We’ll share:
- What Databox is.
- What Geckoboard is.
- A head-to-head comparison of Databox vs. Geckoboard.
- How to know which is right for you.
What is Databox?
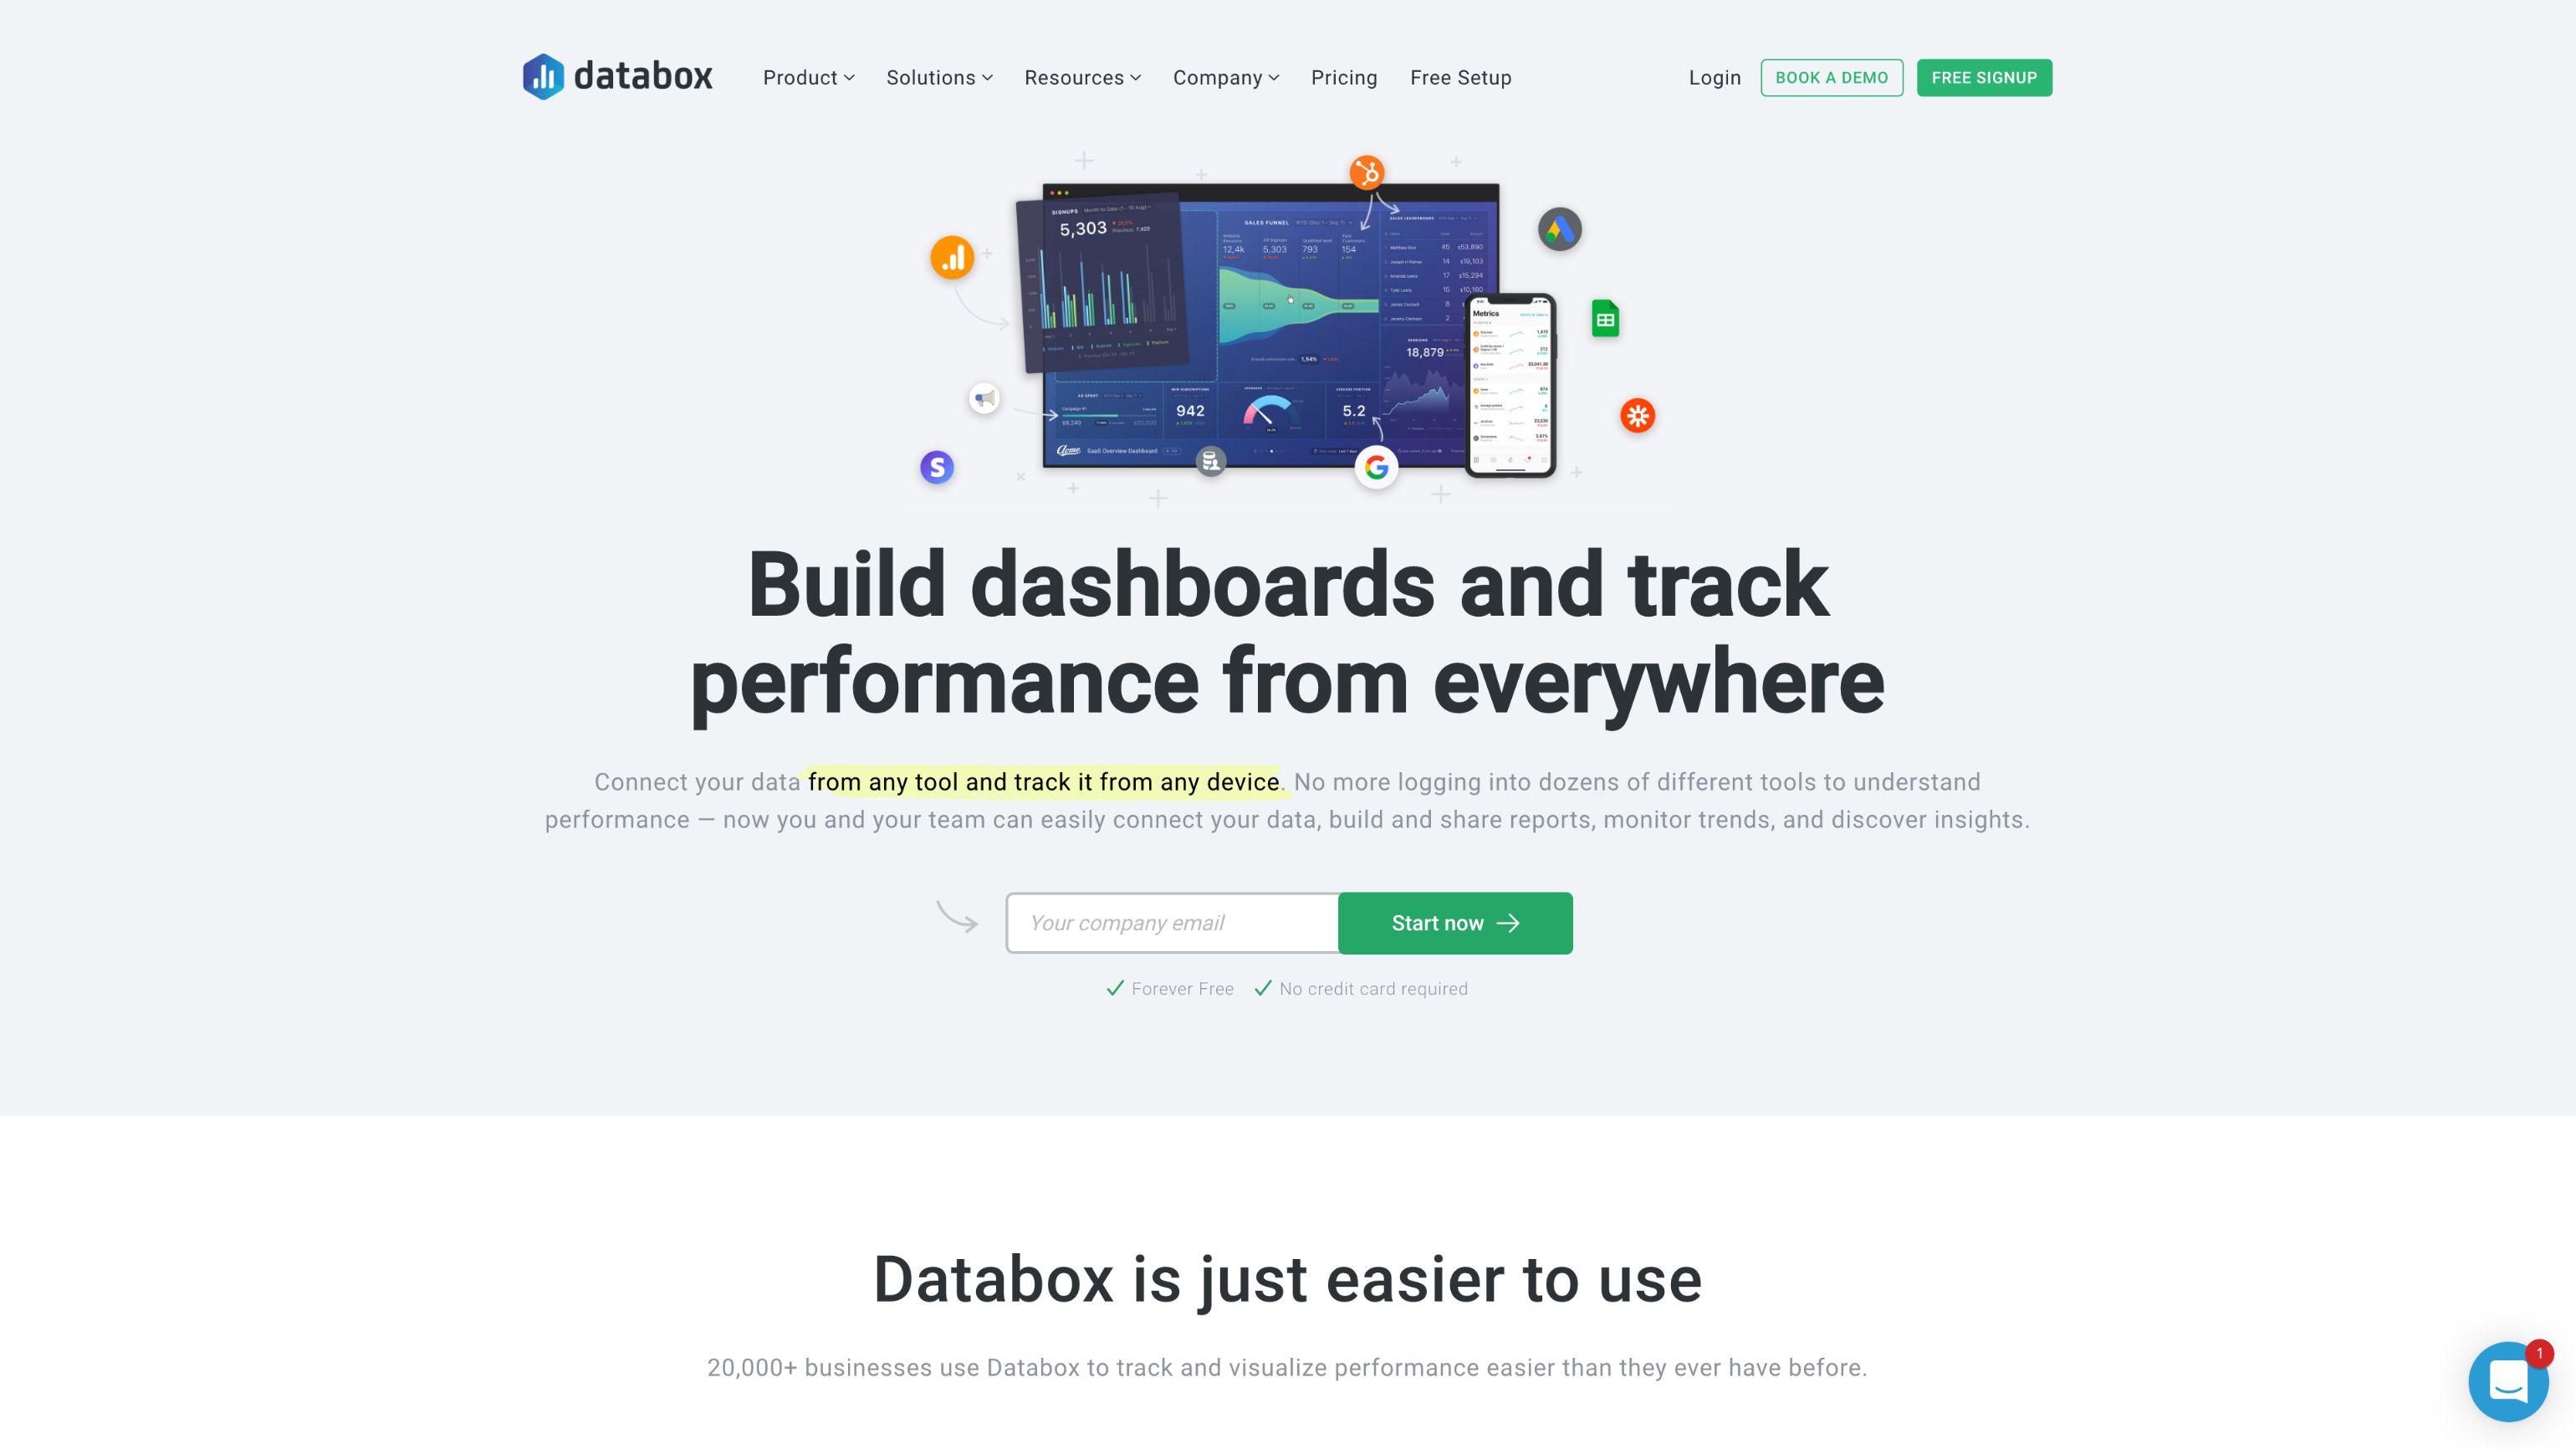
In a nutshell, Databox is a business analytics platform designed to help companies of all shapes and sizes monitor, analyze, and improve on the performance of the metrics that matter to them most — all in one place and in real time. With it, users don’t have to log in and jump from platform to platform to see all their numbers.
It touts its ability to connect data from any tool, track it from any device, and then easily build and share detailed custom reports, monitor trends, and discover insights.
To accomplish this, Databox offers 70+ one-click integrations (for popular tools like HubSpot, YouTube, Facebook, Eventbrite, and Paypal), and can incorporate others using SQL database, Databox API, Google Sheets, Excel, and even third-party integrations like Integromat and Zapier.
Once synced, the dashboards are optimized for viewing on desktop or mobile (via the Databox app), streaming to smart TVs, Apple Watch, and more.
From there, the platform offers a variety of reporting features that ultimately allow businesses to:
- Align teams around the right metrics and goals.
- Automate reporting.
- Track performance in real time.
- Effectively monitor data to capitalize on future opportunities.
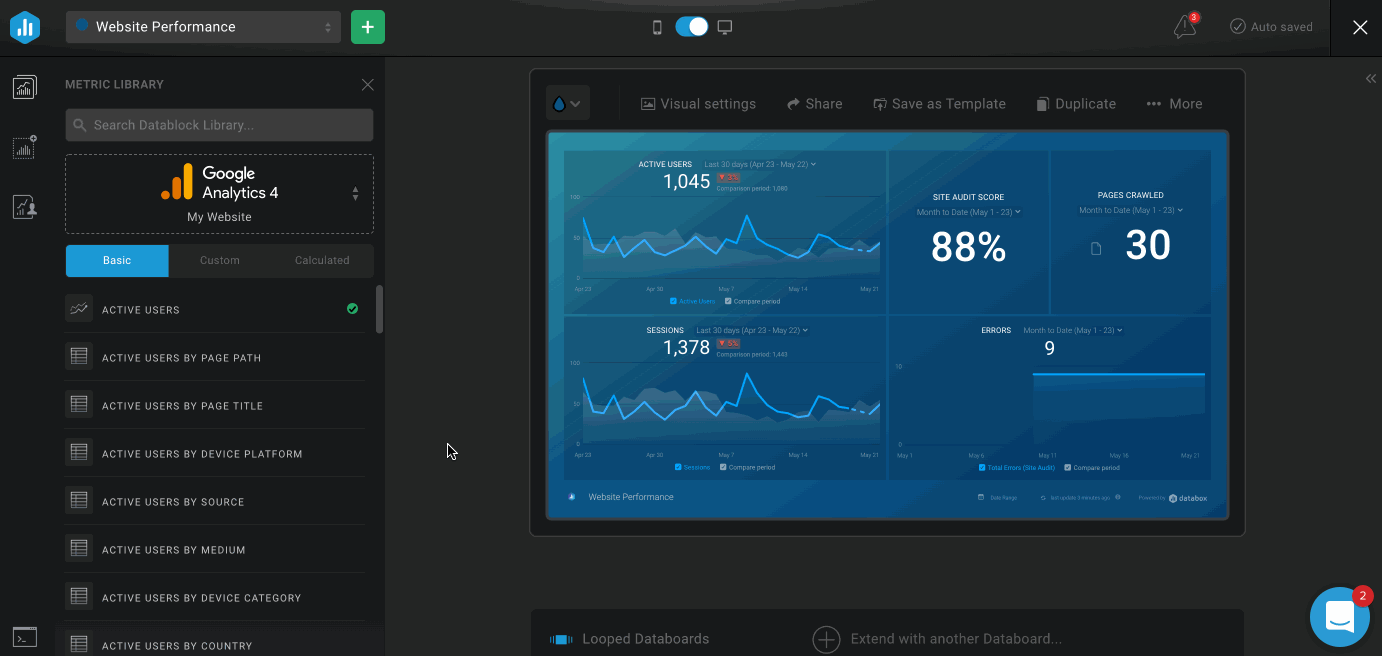
Databox offers a range of pre-built dashboard templates to help businesses track common metrics and KPIs related to SEO, marketing, social media, and more. Users with other needs can create custom dashboards in a matter of minutes. It also has useful features that allow agencies to manage client accounts and campaigns from one single platform.
What is Geckoboard?
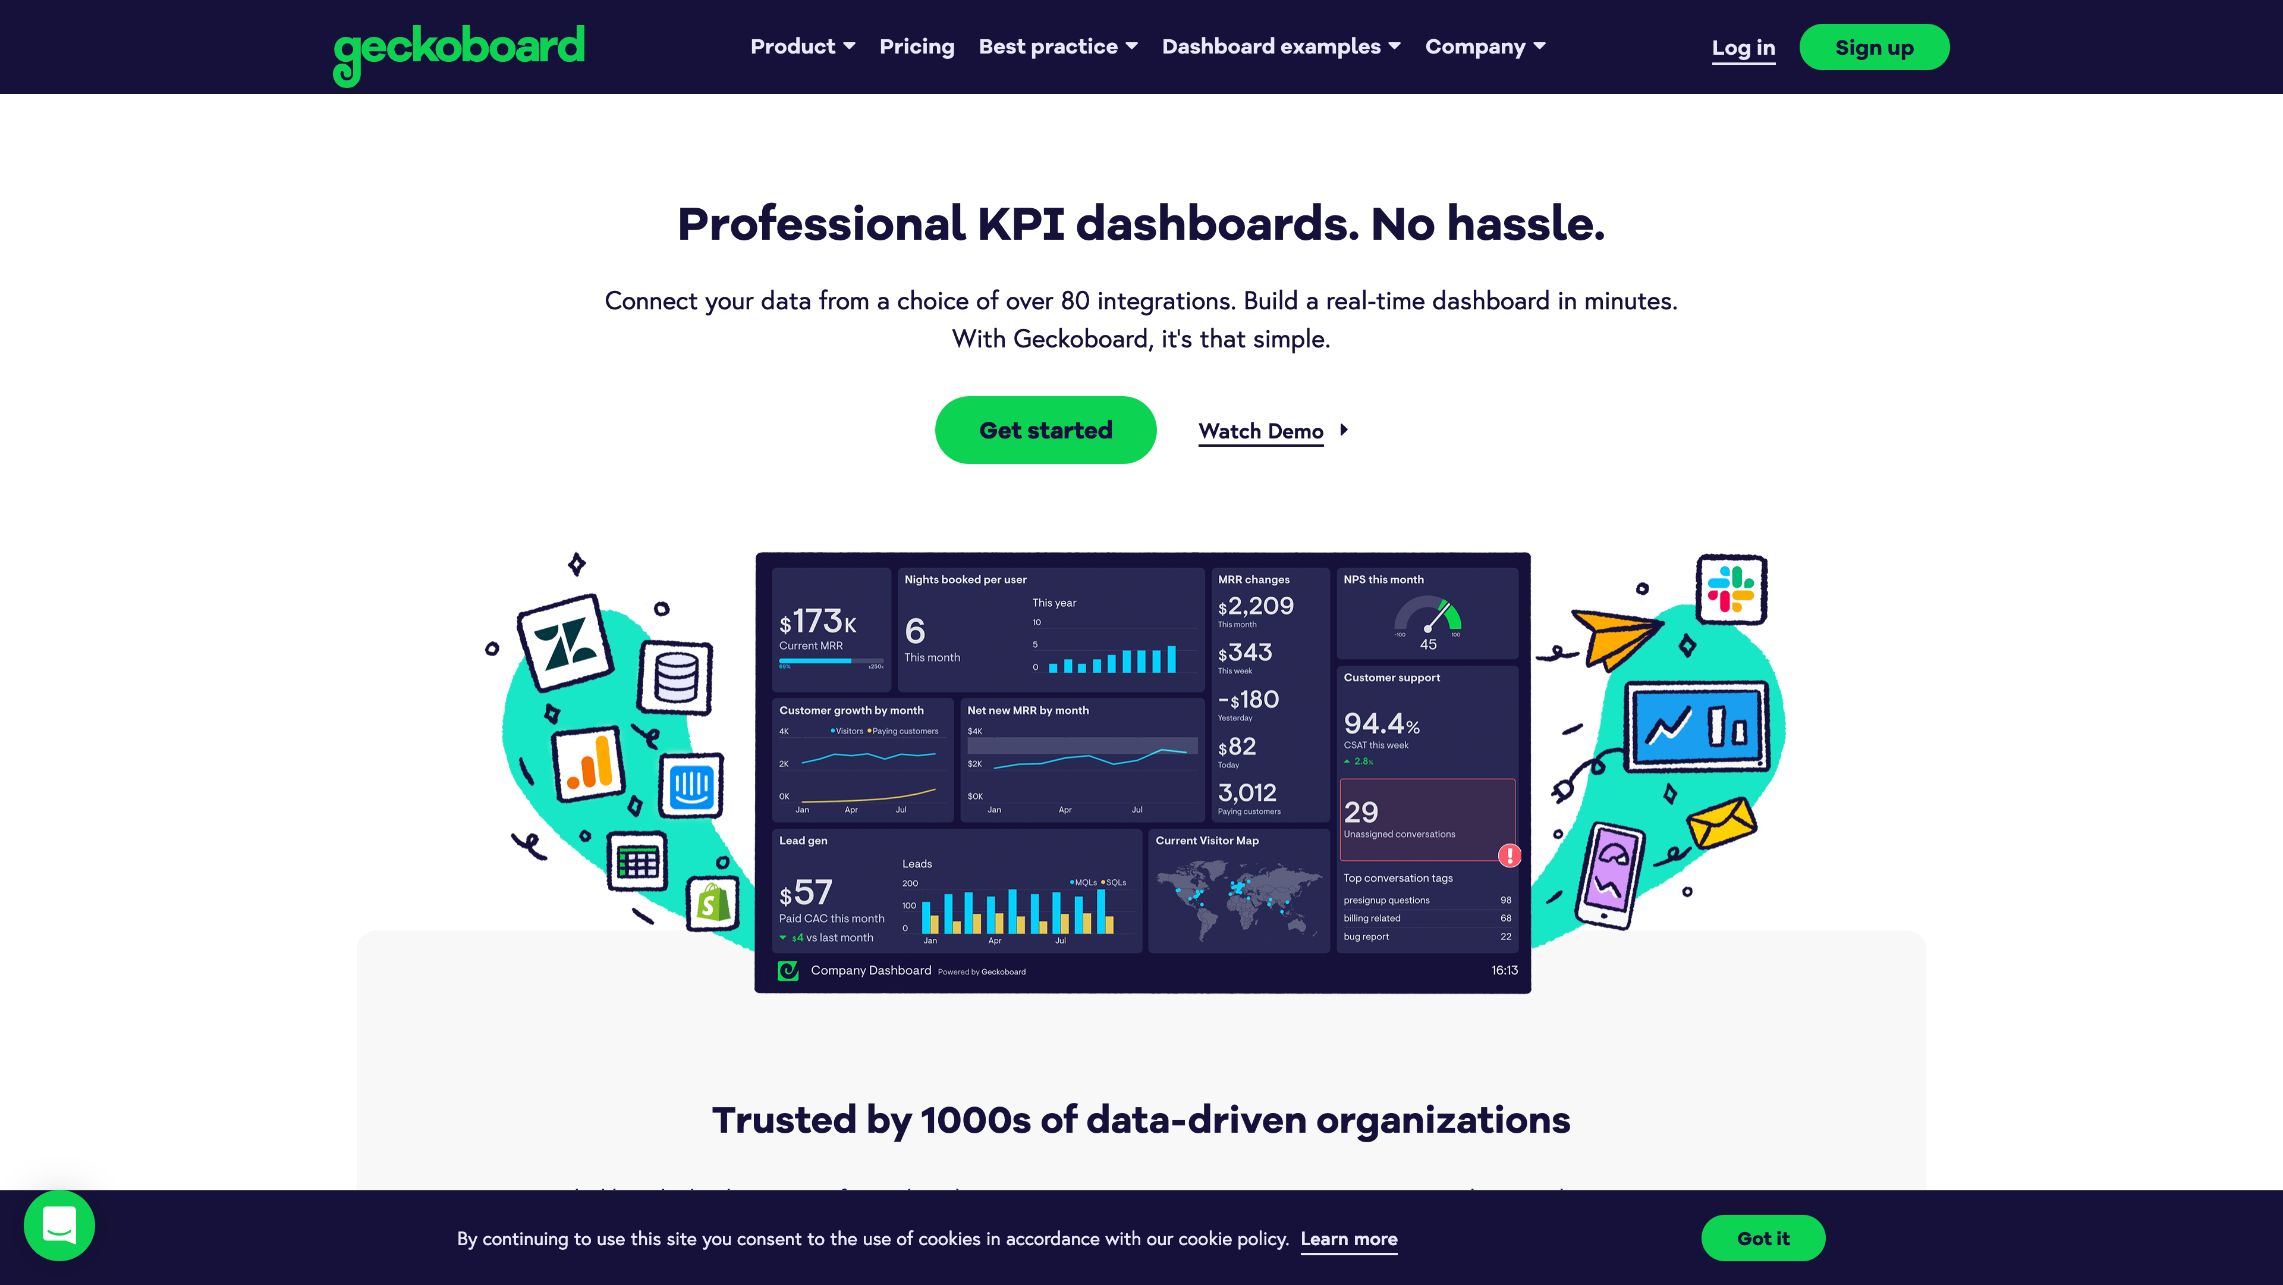
Geckoboard is a software company designed to help organizations put data at the heart of their decision-making and culture. How does it do this?
The features set out to overcome the three significant barriers an organization faces when it comes to data:
- Access: With Geckoboard, you can compile data from several sources into one place.
- Understanding: Data visualizations help users understand their performance at a glance.
- Awareness: Sharing reports and dashboards makes data a part of your everyday life.
Similar to Databox, organizations can use Geckoboard to build professional real-time data dashboards for over 80 tools (e.g., Google Analytics, Google Sheets, Zendesk, and Salesforce) while also pulling in additional data using spreadsheets, databases, Zapier integrations, or their custom API.
From there, data can be viewed on a desktop, sent to Slack, or streamed to any smart TV or PC to make monitoring your analytics as convenient as possible. While dashboards can be generated from practically any business data, Geckboard primarily focuses its solution on customer service and eCommerce-based businesses.
A head-to-head comparison of Databox vs. Geckoboard
Like many competitors, on the surface, Databox and Geckoboard seem quite similar. They have similar offerings and promise many of the same things, but when you dig deeper, the intricacies of how they are used and who they will benefit most day-to-day becomes much clearer.
Let’s take a closer look, comparing them more directly in four key areas:
- Building dashboards
- Customization
- Sharing
- Cost
Building dashboards
Databox
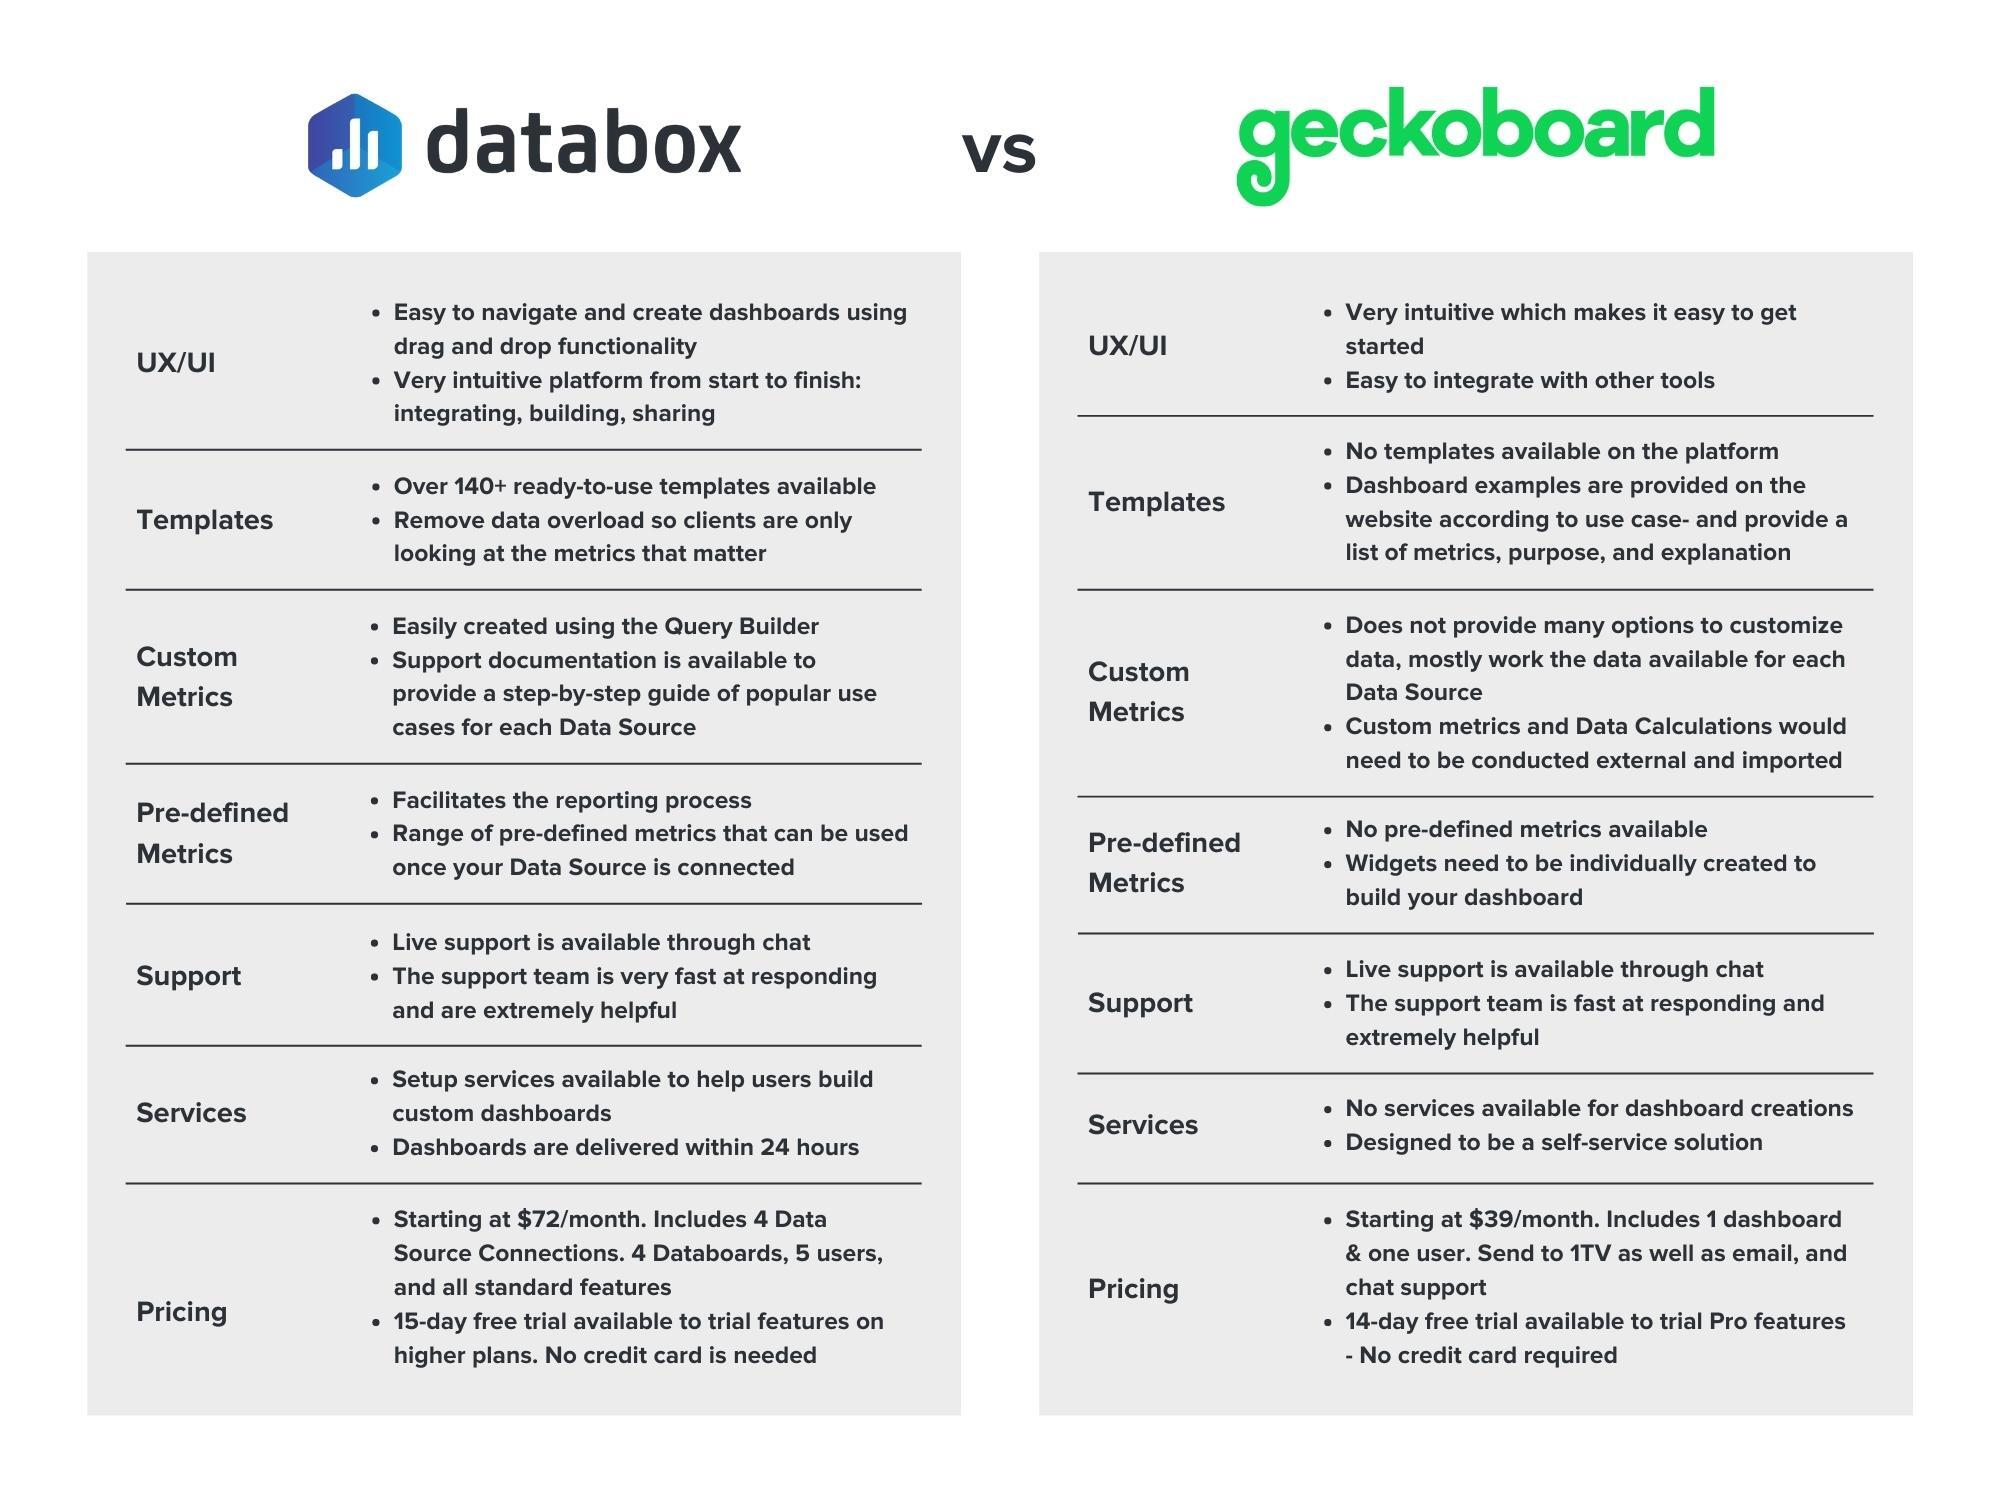
Databox Designer provides an easy way to build and customize dashboards with its drag-and-drop functionality. With this, even if you’re not tech-savvy or are not familiar with coding, the process of building a new dashboard is intuitive and easy: You simply select the metric you want, drag it to where you’d like it to appear, and it snaps into place.
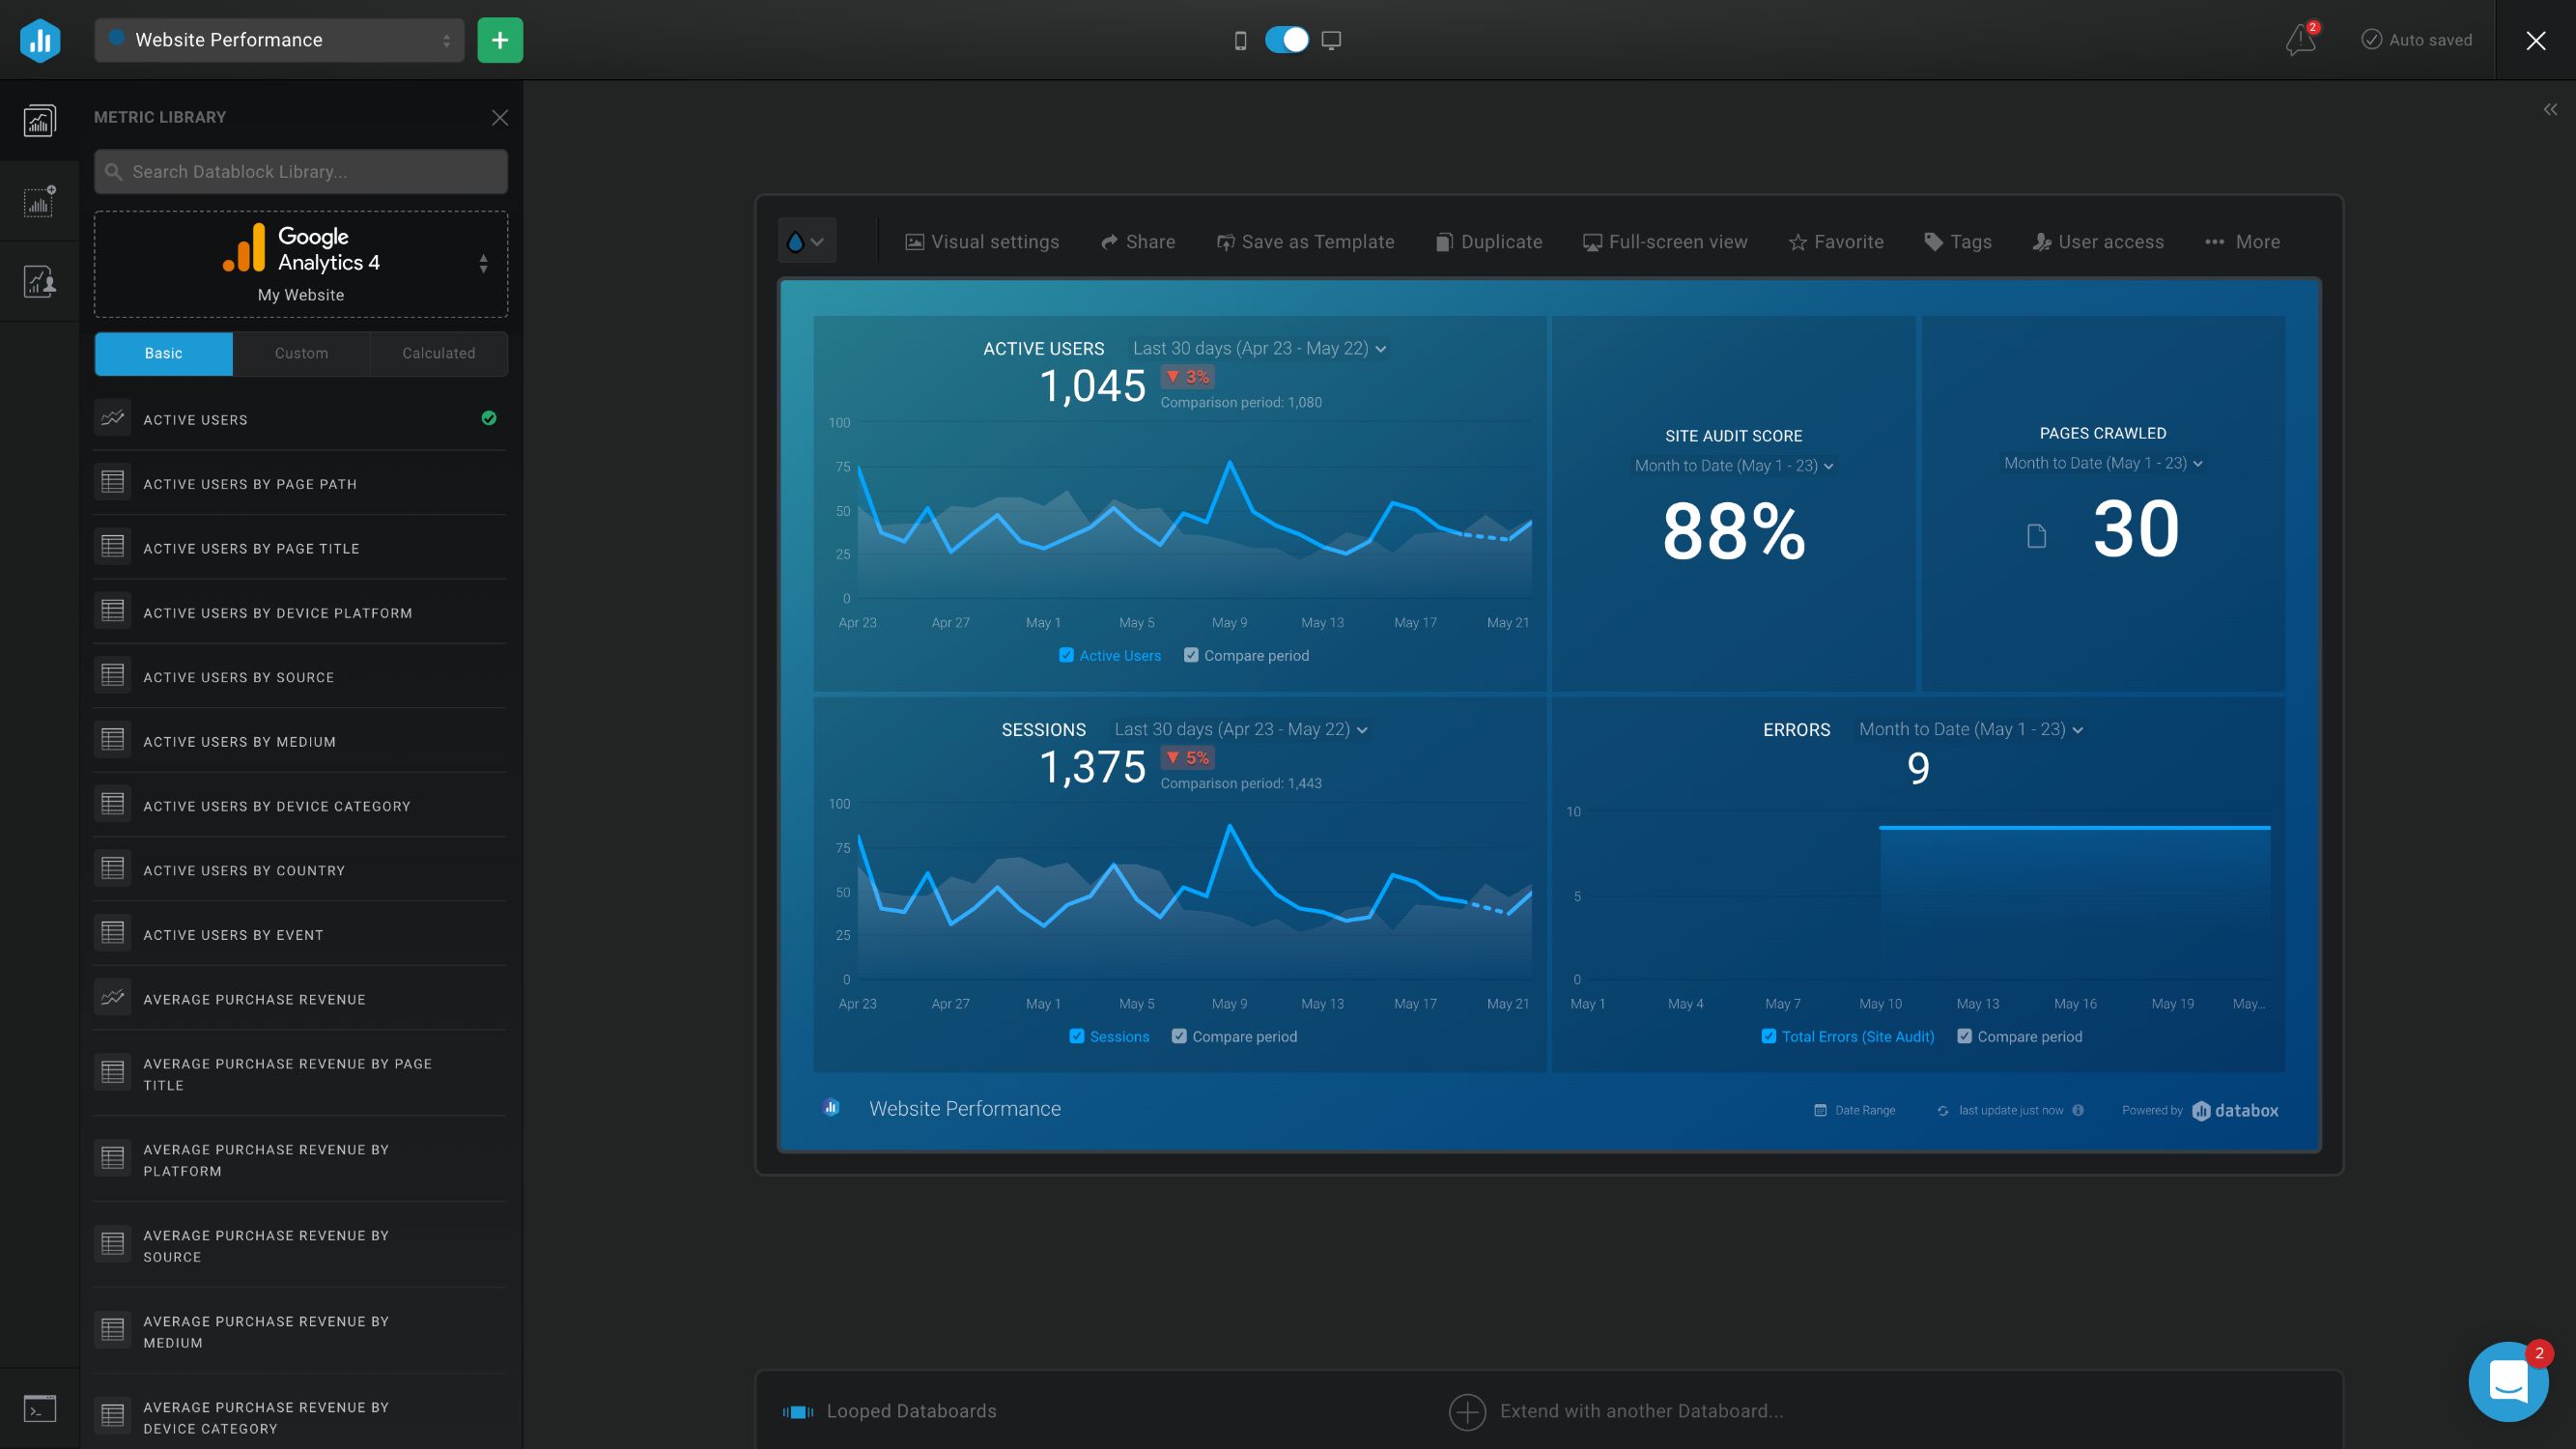
With these few clicks, users can easily integrate different data sources and use the basic metrics (predefined metrics) provided to create dashboards.
Basic metrics are a combination of a metric with a data visualization.
Each data source that you connect to Databox will have a list of pre-configured metrics. So, if you connect to Google Analytics, you can access the metrics library and use 74 basic metrics. This makes the process of creating something custom easy and intuitive.
From there, Databox offers a range of beautiful and professional data visualizations that enhance your data presentation and makes information easy for anyone to understand. The platform also offers annotations that allow you to add more context and explanation to trends as needed.
Databox’s simple visualizations help users better understand complex data while still keeping the presentation professional.
Geckoboard
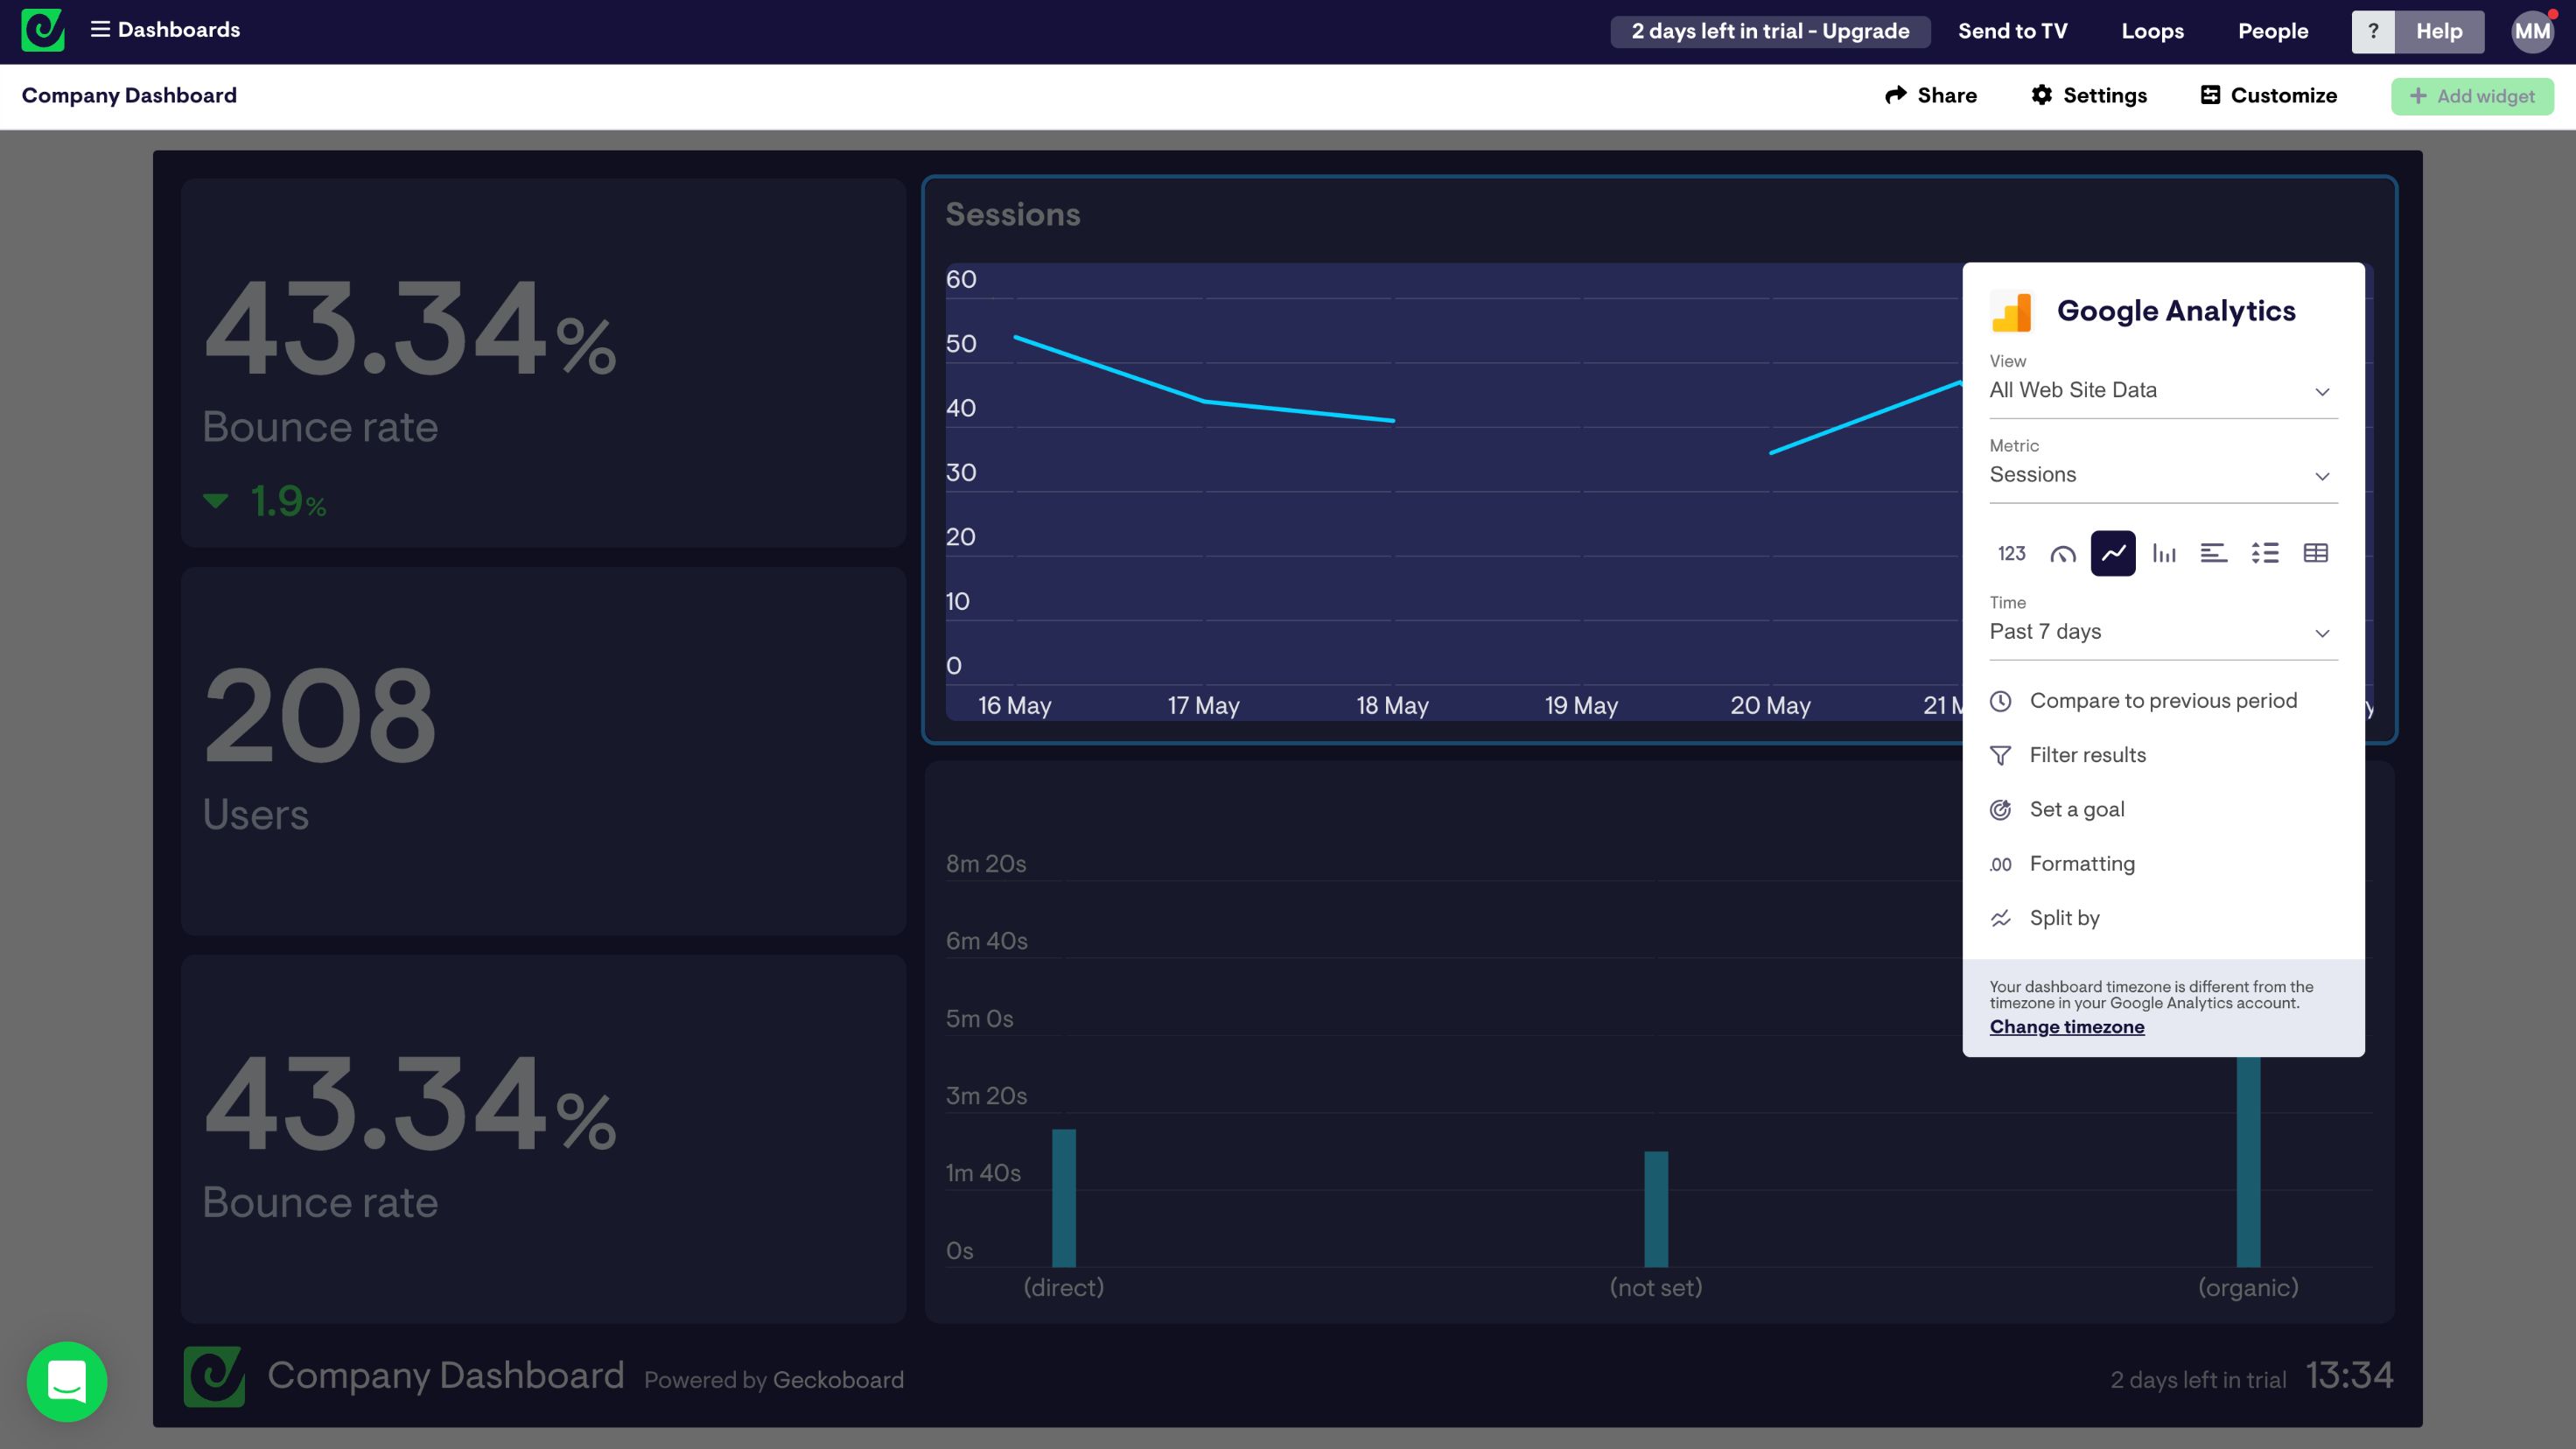
As noted, Geckoboard can integrate 80 tools (and growing) into one dashboard through what it calls “widgets.” This means you can view analytics data, email analytics, financial analytics, eCommerce data, and more all in one place.
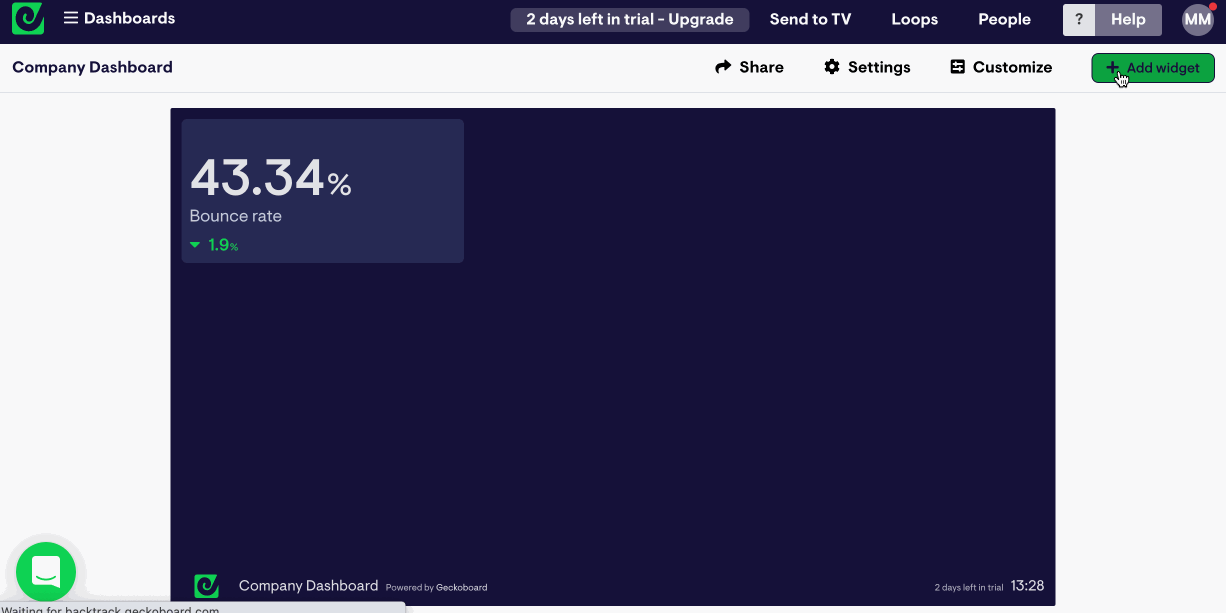
From there, Geckoboard allows you to select the metric you want to view from your connected data source and turns it into clear, straightforward visualizations that help explain the data in a more effective way.
The simplicity of adding widgets to your dashboard makes the process of creating live dashboards easy and efficient and you can even create separate dashboards to filter the data depending on the department that needs to access it.
Customization
Databox
Ease of building is great, but every business and team is different and you may find you need something a little different or unique to best communicate your data. With Databox, that customization is easy.
Databox Data Calculations and Query Builder help you customize your data to provide more context into the performance of your metrics.
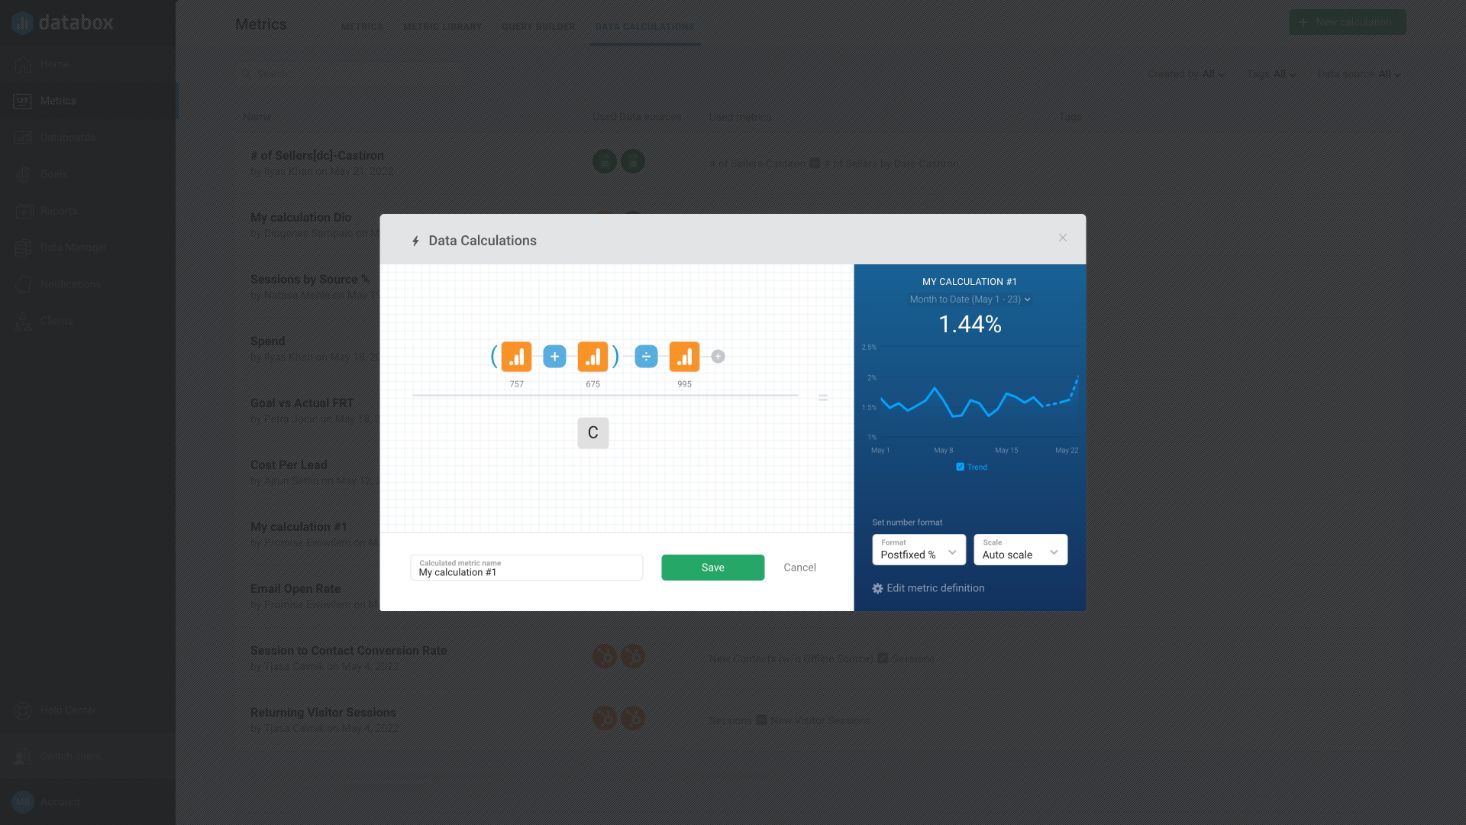
Databox’s Custom Data Calculation
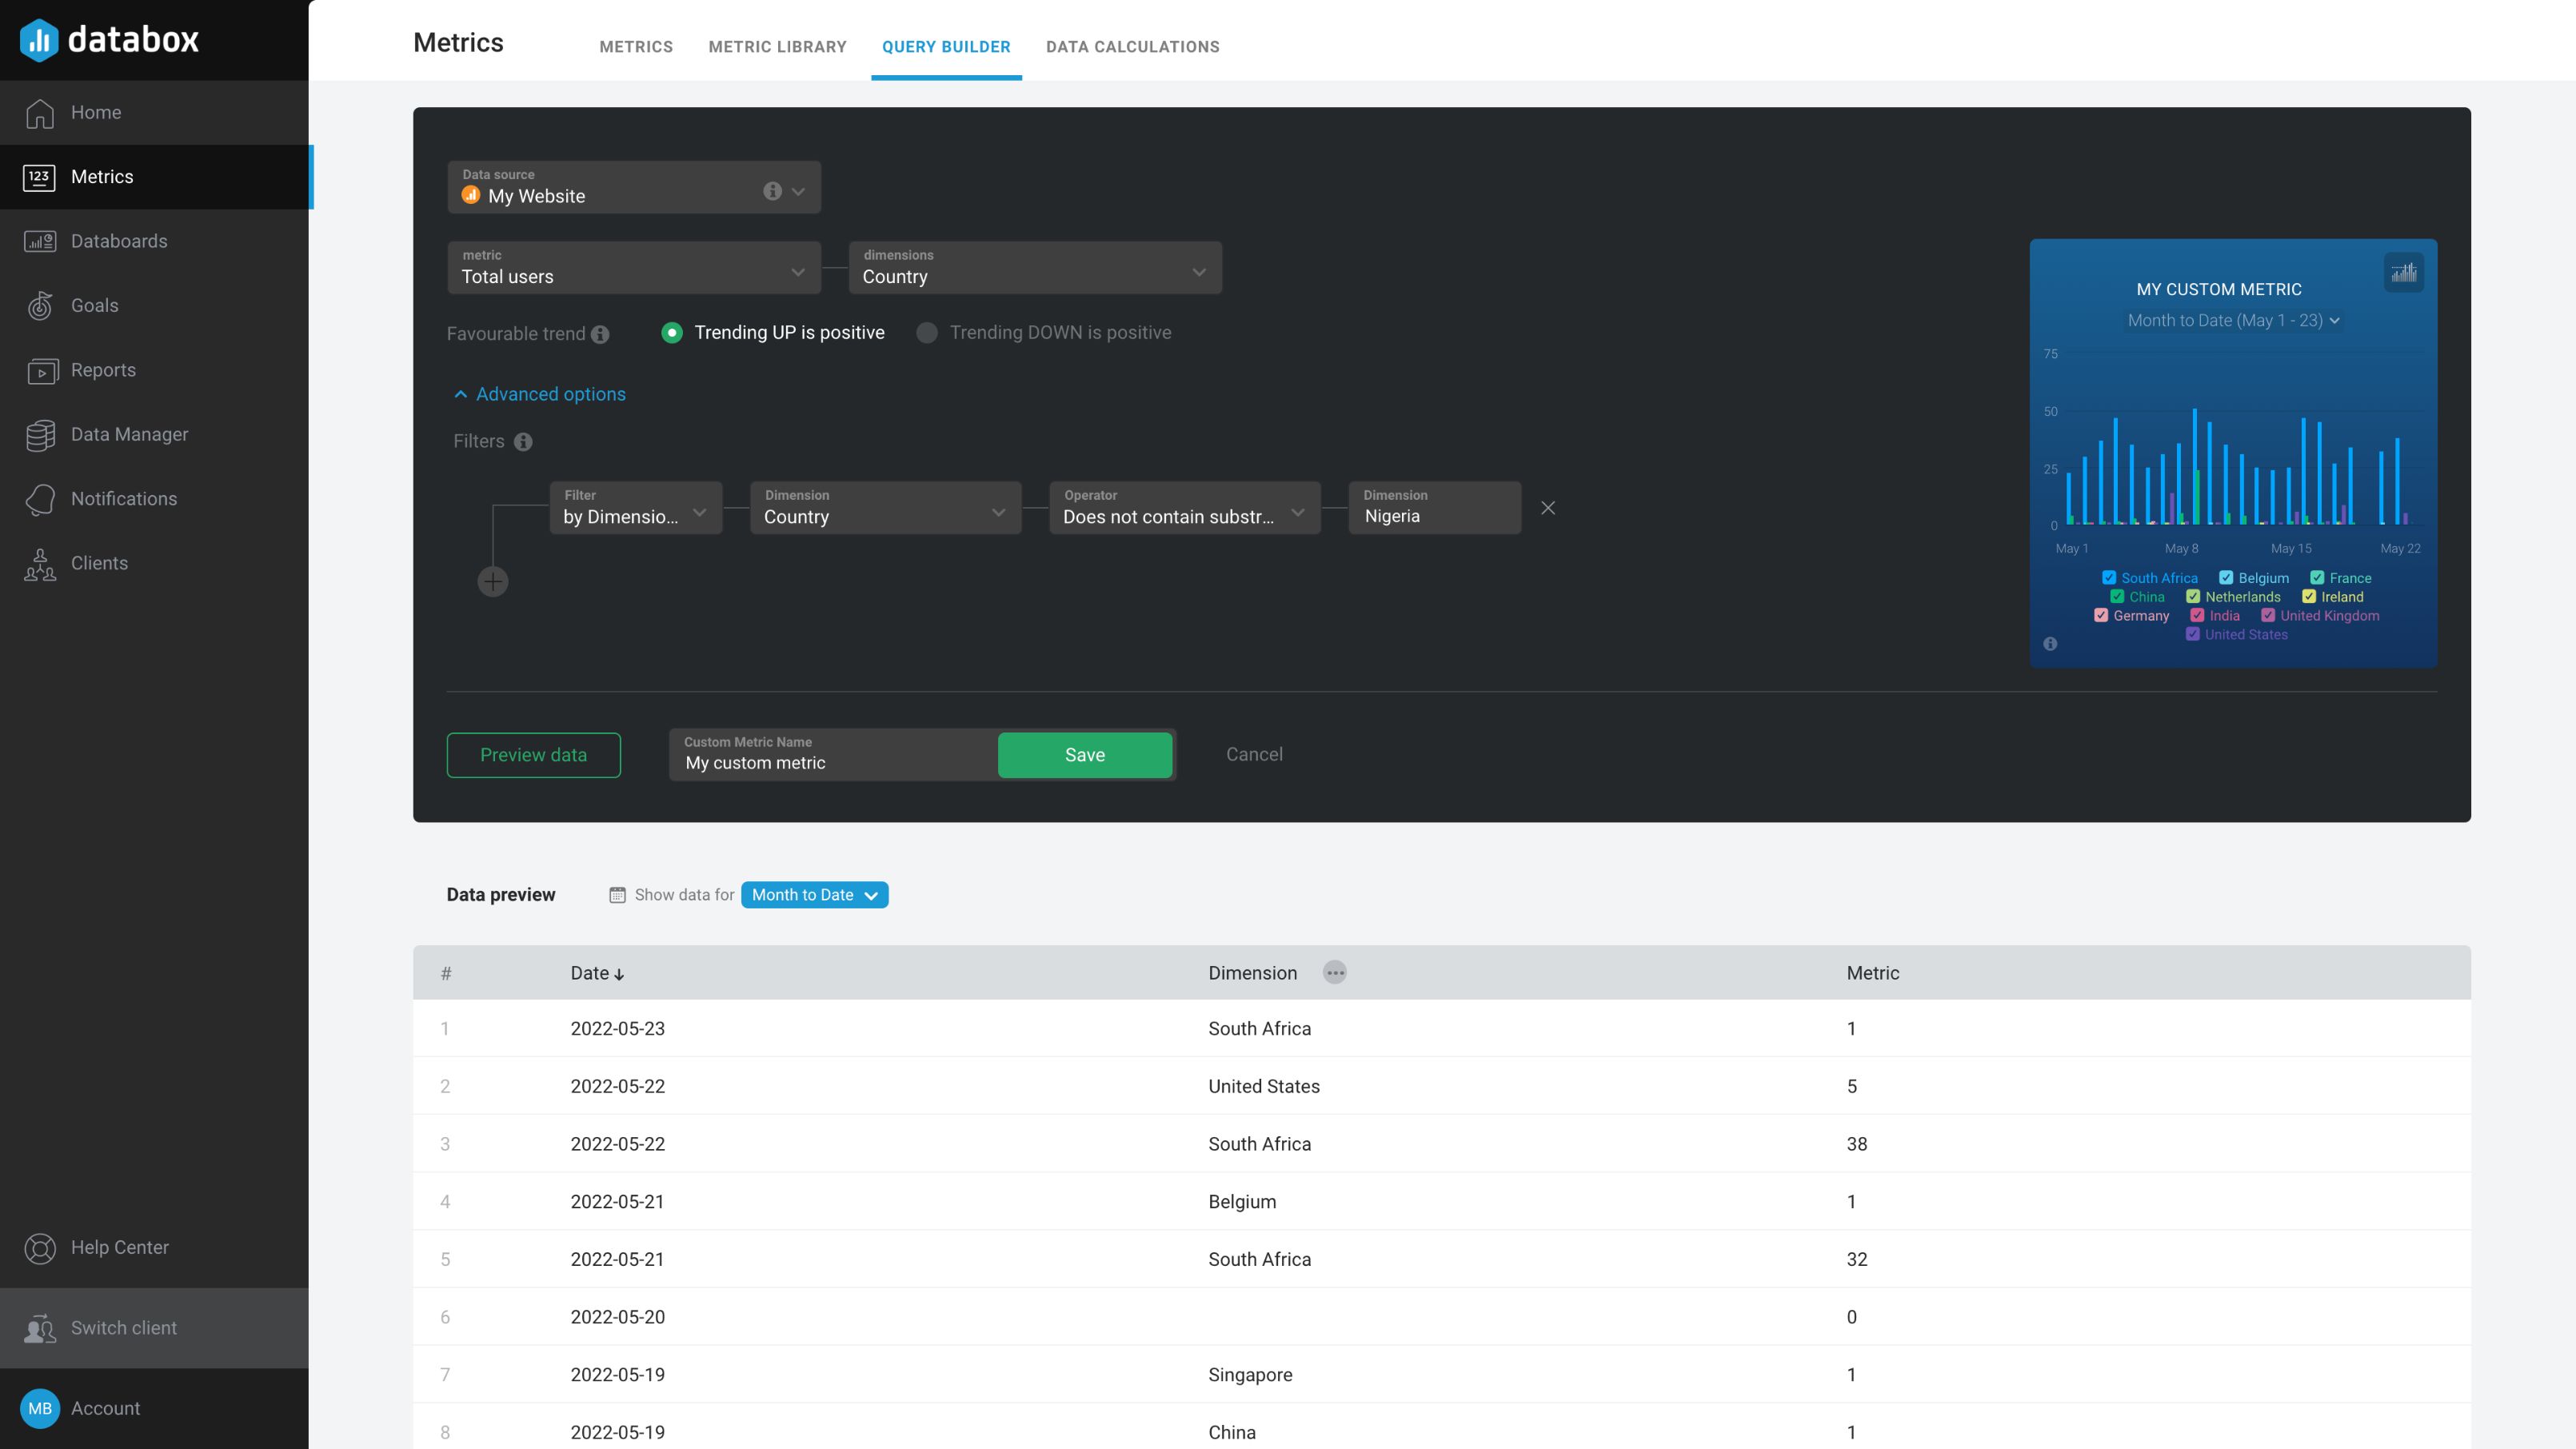
Databox’s Custom Query Builder
These features give you a lot of control over how your data is managed, updated, and presented by allowing you to:
- Adjust the displays of metrics.
- Define advanced data modeling features.
- Filter data according to set specifications.
Plus, by integrating with Google Sheets and Excel, Databox gives you the ability to track any metric that is important to your organization, even if the integration is not natively available.
Geckoboard
While building your dashboard and selecting visualizations is quite easy in Geckoboard, the platform does not provide many options for customization beyond that.
It essentially visualizes data from the integration or spreadsheet as provided. Unfortunately, you cannot perform calculations with this data to dig deeper or identify more complex trends.
Any calculations or advanced data filtering need to be created on a spreadsheet and then imported into the dashboard.
When creating your widgets you are also limited to predetermined fields of the data. There is not much ability to edit what is being displayed. In other words, you can’t:
- Edit widgets names.
- Add more columns to a table.
- Adjust font size.
- Adjust granularity.
- Include total values on line charts and bar charts.
Sharing
Data is only valuable if people are actually seeing and using it. That’s why sharing options are so important with an analytics tool.
Databox
Sharing dashboards and reports from Databox is easy. You can use a sharable link to easily share a live link to your dashboard or send scheduled snapshots to export your dashboards into PDF or JPGs at regular times.
In addition to this, Databox can be accessed from multiple devices (Apple Watch, Mobile App) and streamed to televisions and large monitors, making it easy to keep your eye on the numbers from anywhere or even display in your office.
This consistent presence of your real-time data helps you make more informed business decisions and cater your daily tasks.
Even if you’re not looking at a dashboard, Databox offers a variety of Notifications (e.g., daily schedule snapshots, emails, and Slack notifications) to help you monitor your data in real time and stay apprised of emerging trends.
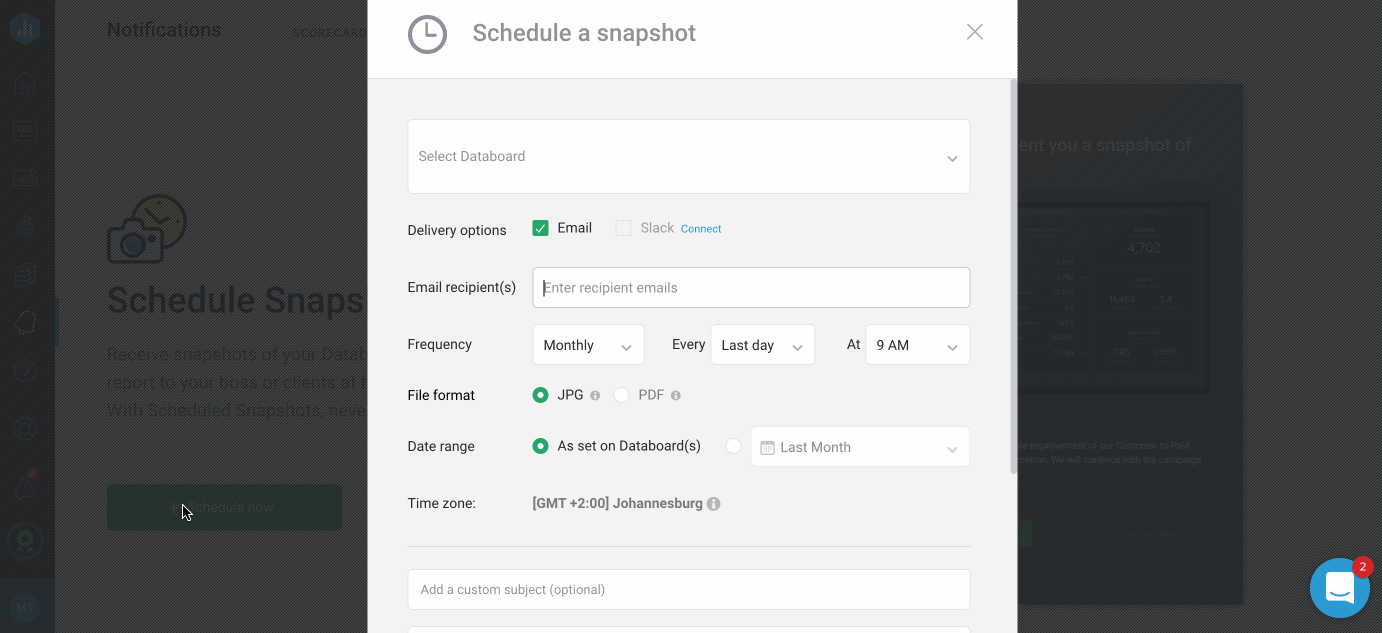 You can use notifications to provide more context into KPI performance by tracking performance against your goals.
Geckoboard
Like Databox, Geckoboard enables you to access data via:
- Shared link
- Email (Scheduled Snapshots)
- Slack (Scheduled Snapshots)
- Invite (Invite users to access the dashboard via email)
- Mobile app or browser
It also allows you to display KPIs on a television screen, which is a great way to drive team performance and share data with your team. There does not currently appear to be any functionality available specifically for Apple Watch.
Cost
Last, but not least, we have cost. For many organizations, cost may be the biggest make-or-break factor when purchasing a tool, but for something as essential as your data, we’d argue you should look at the value of each tool before looking at their price tags.
Databox and Geckoboard offer free trials and free limited products to give you a taste of what they have to offer.
From there, Databox plans start at $72 per month and include four data source connections, four dashboards, five users, and all standard features. Geckoboard starts at just $39 per month, but this only includes one dashboard and user, and the ability to share via email and display on one television.
So, which data analytics platform is right for you?
In the end, the choice between Databox and Geckoboard comes down to your business’s specific needs. Both are easy-to-use, effective solutions, but when faced with this decision, ask yourself, what am I really trying to do with my data?
If you’re simply looking for an easy way to visualize, monitor, and display/share analytics among your team, Geckoboard is a simple tool that gets the job done. It’s catered to team leaders in small to medium-sized organizations looking to improve the visibility of KPIs and goal achievement.
If you’re looking to dig deeper into your data and find more than meets the eye, Databox may be more your speed. Databox also provides an easy way for people with little code or data experience to visualize, monitor, and display/share analytics, but it then lets you customize your dashboards and reports to meet your needs.
Databox also allows you to choose your dashboard and reports from a robust template library or build one of your own. You can take your imported data and perform custom calculations or build custom queries to identify complex trends and pull insights unique to your business and needs.
Unlike Geckoboard, which simply shows data as it is input, Databox can help you uncover more complicated insights to inform and adapt your practices.
These robust abilities are well-suited for large businesses and agencies where strategic pivots are a regular occurrence. It can be especially valuable to marketers, sales representatives, executives, account managers, operations teams, and others in similar fast-paced roles.
Overall, Geckoboard is best for internal teams and businesses looking for simple and direct ways to monitor their data, while Databox is best for those looking for an easy-to-use solution for data monitoring as well as custom queries and deep flexibility, strategic insights, and automation.
Why is metrics tracking and data analysis so important to your inbound marketing success? Find the answer, as well as how to use HubSpot to get started, in our IMPACT+ course, “Fundamentals of ROI Reporting in HubSpot.”
Free Assessment:
/Assets/Icon%20Library/x%20corp.svg)
/Assets/Icon%20Library/whatsapp%20logo.svg)
/Assets/Icon%20Library/Email.svg)
/Assets/Icon%20Library/Arrows/Grey%20Arrow%20-%20Prev.svg)
/Assets/Icon%20Library/Arrows/Grey%20Arrow%20-%20Next.svg)