/Assets/base/Navigation%20Icons/TAYA.svg)
/Assets/base/Navigation%20Icons/Sales.svg)
/Assets/base/Navigation%20Icons/Web%20design.svg)
/Assets/base/Navigation%20Icons/HubSpot.svg)
/Assets/Icon%20Library/AI%20Mastery.svg)
/Assets/Icon%20Library/Learning%20Center%20Laptop.svg)

Aug 15, 2019
/Assets/Icon%20Library/x%20corp.svg)
/Assets/Icon%20Library/whatsapp%20logo.svg)
/Assets/Icon%20Library/Email.svg)

“What gets measured, gets managed.”
This is a popular quote from the management expert Peter Drucker.
Personally, I love this because it applies to virtually any business operation and promises that if I start measuring what I’m doing, I’ll get a handle on it. That it will give a fair understanding of at least what needs improvement and where my effort should be focused.
Building an online community is also no exception. The metrics associated with this activity needs to be clearly laid out so there is clear accountability on the team and every effort is tied to the ultimate organizational goals.
66% of companies are building different types of communities. In fact, in the US more than 56% of adults are already using online forums/communities for self-service according to Forrester.
They’re an extremely valuable asset for businesses, but only if they’re measured correctly.
In this article, we will focus on the customer-facing communities (rather than communities for individuals within your company) and how you can measure their success effectively for your organization’s goals.
In the subsequent sections, we’ll elaborate on how community managers can quantify the value of the member relations, measure the impact of user-generated content, show the overall return generated from the community, and communicate the same to the leadership to justify their investment and get internal buy-in and support from the rest of the company.
Broadly, all of the metrics for a customer community can be segregated into the following three sections:
- Effectiveness of the user-generated content
- The vitality of the community
- Impact of the community on the business goals
Let’s cover each of these categories individually.
1. Effectiveness of the user-generated content
Every community, irrespective of the number of the members, generates content and, it is important for the community managers to understand the performance and value of this content.
Once you understand this, it’s easier to steer the content generated in your community in the right direction. Insights you can uncover include:
- What type of posts (e.g., questions, discussions, ideas) are successful?
- What type of blogs/articles written by the members drive the best engagement (comments/visits/upvotes)?
- What types of polls are able to get the most number of responses?
- What types of events get the most number of turnouts?
Each of the above insights are tied to an end goal (success, best engagement, number of responses, etc.), but only you can define this for the content generated in your community.
The first step in doing this should be about setting up a scoring system for the content.
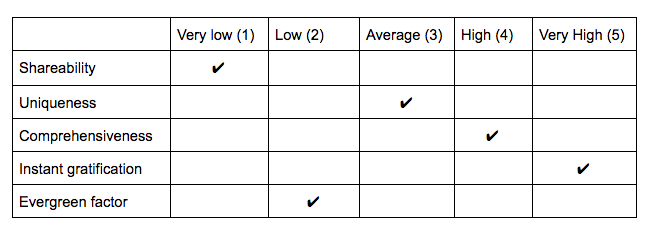
For example, if you’re looking for shareable content that’s unique and evergreen, a typical customers community could have the following criteria:
- Shareability (Number of time the content was shared by members)
- Uniqueness (How unique is the content from the ones already present in your community?)
- Comprehensiveness (How comprehensive is the post?)
- Instant gratification (How quickly can the reader implement the takeaways?)
- Evergreen factor (Will the content be in demand 10 years down the line?)
You can add and remove parameters depending on the type of content produced by your community, your goal, and how you define success.
Once you have them, finally, you can assign a score to the content based on a likert-scale (1-5 points).
Simply put, you would assign a weight to different parameters and multiply that with the point to calculate the average.
For example, if, in your case, the evergreen factor has more importance than shareability, then evergreen factor would get higher weight. This means more evergreen content may score even higher than content that scored highly in the other categories but isn’t evergreen.
In the below example, the particular content piece gets the cumulative score of 15. Whether this is good or bad is dependent on your organization’s definition, but the point is, with this score, you have something definitive to go off of.
You can also go a step further and calculate the success score based on a weighted average.
A community platform such as Tribe can help you export complete data set around your content and the members who create it with the click of a button. This screenshot below shows how data associated with questions can be downloaded.
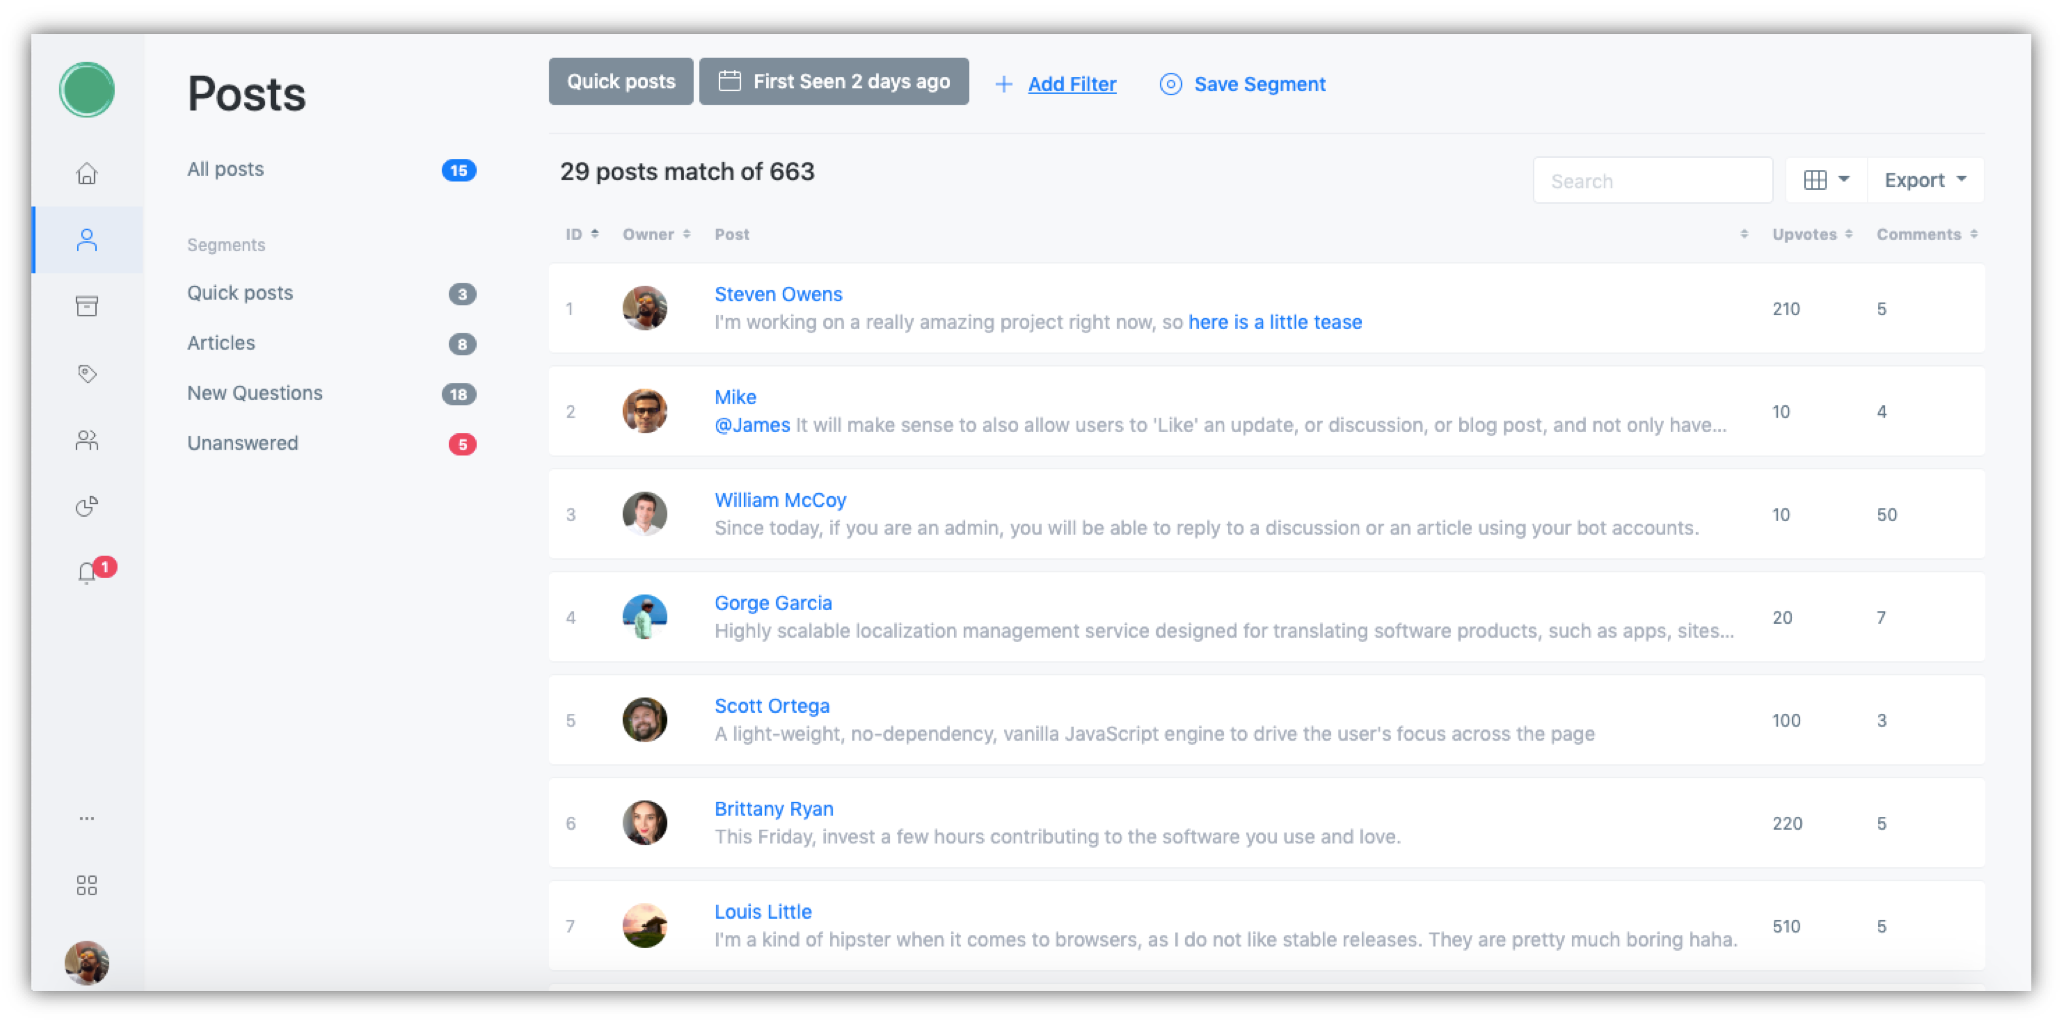
Note: The downloaded data set contains many additional data fields which are not shown on the tabular view in the web page.
Now, it is time for you to export data from the community platform you are using and rate the content on an ongoing basis.
Here’s what that can look like:
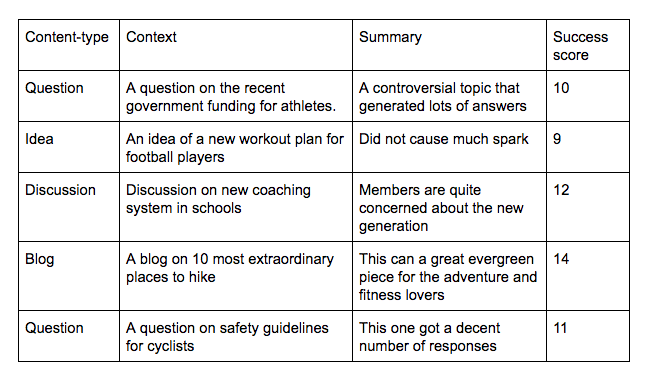
Once this exercise is done, you should try to find out the type of content that results in higher success score. The goal here is to uncover patterns in user-generated content that lead to your target, so you can repeat the same consistently.
For example, if you see that ideas posted around the latest government policies are getting very good traction, you can increase this type of content by incentivizing the members by offering points or upgrade account.
2. Community vitality
Here we focus on the state of the community itself; exactly how well it is performing overall. In other words, we try to answer the following questions:
- What’s the growth rate of the community?
- How “sticky” is the community?
- What’s the churn rate of the members?
- Which member cohort is the most active in the community?
- How is the active member cohort changing with the growth of the community?
- What’s the retention rate of active users over time?
Ideally, the community platform that you are using should have in-built reporting system along with integration with other popular analytics tools such as Google Analytics and MixPanel.
Google Analytics allows you to get a bird’s-eye view of the actions performed in your community by the members, while tools such as Amplitude allow you to measure granular metrics on member behavior like:
- Questions asked
- Discussions posted
- Answers given
- Comments
- Number of Upvotes
- Number of Likes
- Number of Follows
- Number of Unfollows
Note: Tribe Community Platform’s app store contains these types of deep integration with a wide range of third-party tools along with in-built apps to improve the value of the core community solution.
Based on the data gathered from the community, given below are the metrics that you should be tracking:
Visitors per month
An external community focused on customers and prospects should strive for steady growth in the number of visitors per month. This is important as it means the visibility of your community is increasing and you are able to attract your audience. You can easily track this metric with web analytics tools like Google Analytics.
Number of posts per month
Post creation in the community is an activity performed by the members. Steady increment in the number of posts signifies that the members are engaged and they are contributing to the community to get value from it.
When your community generates more content, search engines crawl and index more pages in your community. This further improves the visibility of the community.
If your community platform sends the member activities to your preferred analytics tool, you can measure the number of posts created in your community.
Member growth
In most of the customer communities, the community builder wants to grow the number of members — not just visitors, but those who actually join the community.
This is important as the community should be attracting new and more engaged customers and evangelists in order to thrive. Getting visitors to sign up for the community is the first step in that direction.
Hence, it is a good practice to measure member growth and ensure that your acquisition channels are working. Here is how the growth chart looks like:
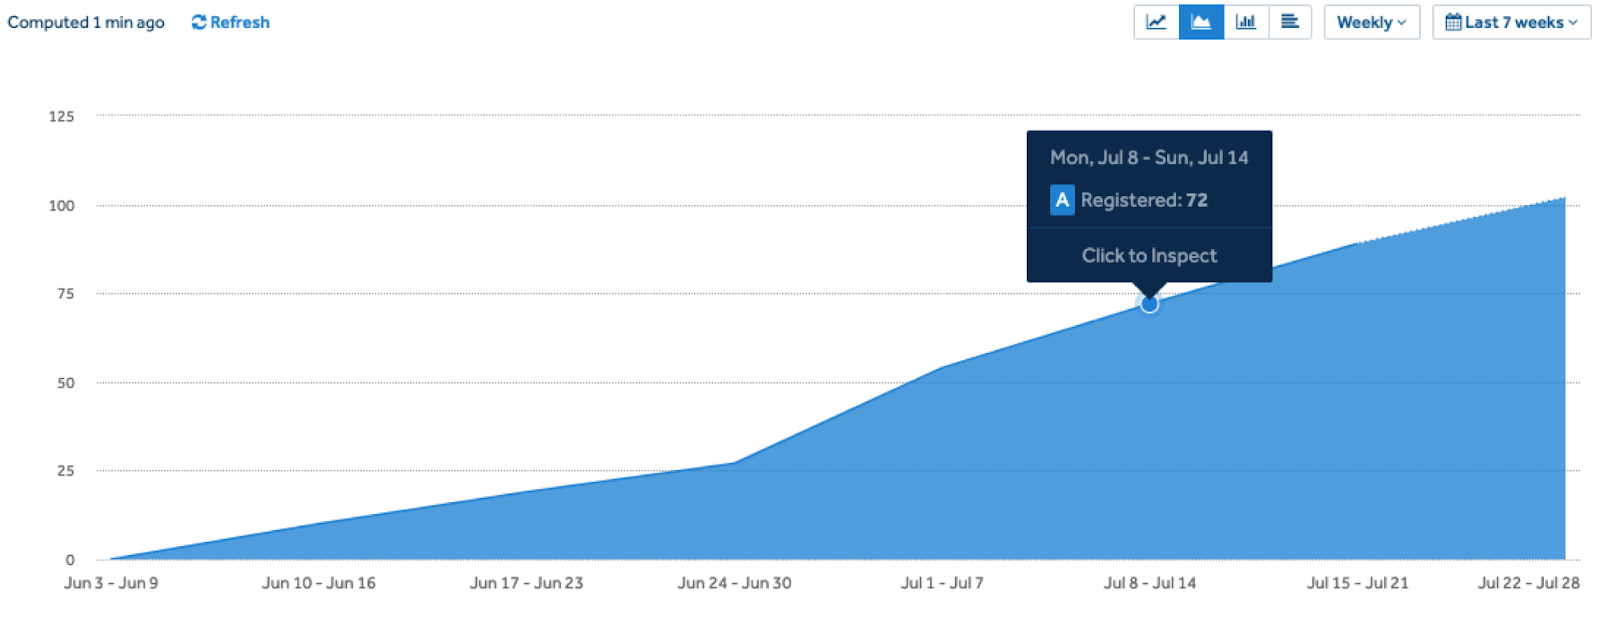
The member growth rate would be calculated based on the following data points:
Number of members at the end of the selected time period = A
Members in the previous time period) = B
Members in the previous time period = C
So, the formula for calculation would be (A-B)/C.
Message origination channel
This metric helps you identify the source of the content that gets generated in your community. For example, your members might have the option to post on your community by directly logging in, replying to an email, or Slack and Facebook Messenger integration.
Now you should measure the channel from which most of your members are interacting and posting content. Depending on the channel, you should optimize the important channels so that the engagement increases.
Text mining
Simply put, text mining employs statistical and machine learning techniques to derive high-quality information about how people are feeling from the text. Since communities generate text content in the form of questions, answers, comments, discussions, blogs, etc. there is a lot of insights to be uncovered. Given below are two use cases:
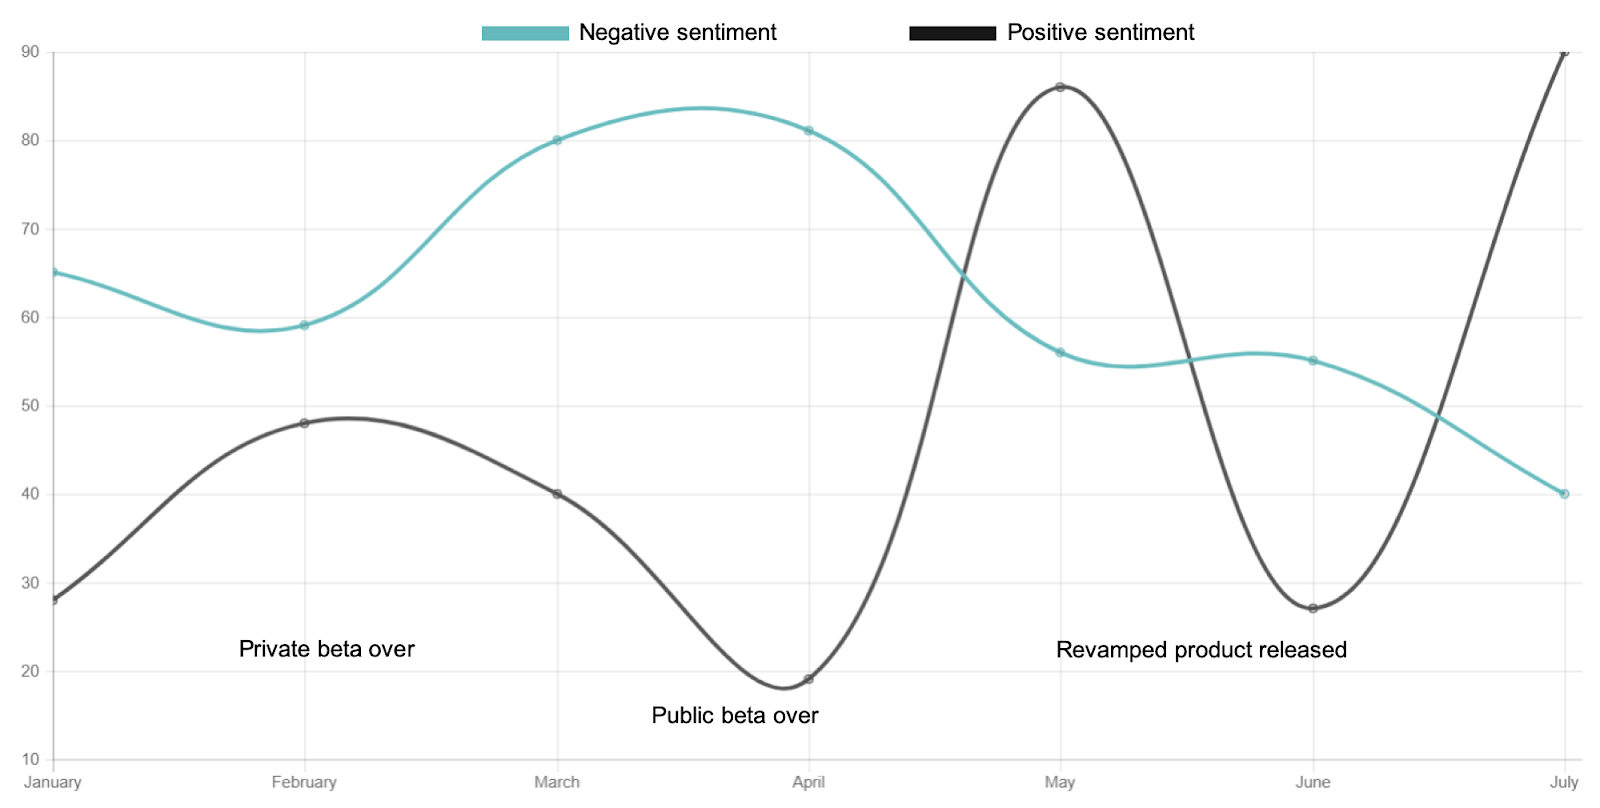
Sentiment analysis
Sentiment analysis uses natural language processing (NLP) techniques to measure emotions (e.g., anger, happiness, excitement, etc.) and sentiment polarity (positive and negative) from data present in different formats like text, visuals, and audio.
Since your community generates a lot of text, it can be a good idea to run sentiment analysis on the content posted by customers.
Especially, if you are running a insights community which helps you collect customer feedback, you would ideally want to increase positive sentiment score and decrease negative sentiment score.
Here is how it would look:
Term frequency
You can apply statistical techniques to find frequently used terms in a specific topic, content type or group.
You can also use sentiment analysis to identify clusters of negative terms and positive terms. Then, you can have more context by identifying the terms associated with the frequently used words.
For example, here is a word cloud based on the term frequency of words present in the questions posted in a community.
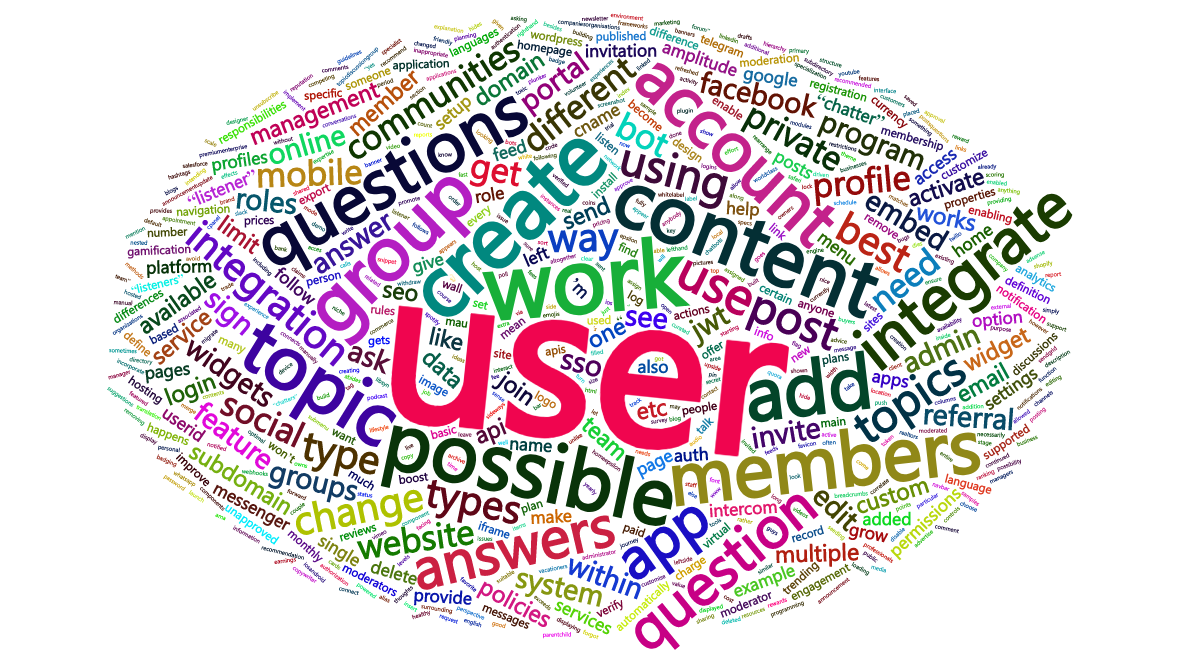
Now, we can further analyze to find out the other terms associated with ‘User’ which is the most frequently used word.
This will help in understanding what exactly is generating conversation or creating interest in your community. Laced with this information you can closely observe if there is an issue and any action needs to be taken from your end for a specific topic.
Churn rate
This metric is used to measure the number of members who stop using your community. For example, churned users could be users who delete their account or those who stopped logging in (became inactive) in the last three months.
Based on the criteria you would need the following data points:
Members becoming inactive or deleting the account in the selected date range= A
Total members at the beginning of the selected date range = B
Churn rate would be A/B.
Stickiness
As a community builder, you want to increase the engagement rate or make sure your community is “sticky”; that it is somewhere people want to return to. In the case of a community (or any other website or app), engagement may include:
- Upvoting a post
- Asking a question
- Posting an answer
It really depends on how you use these activities for your community. Now, you can say that if a member performs these activities, then the member would be considered an active member.
Once this is defined, your analytics tool should allow you to measure stickiness, i.e., how often members engage with your community based on the active user criteria.
Here is what you need to calculate Stickiness:
DAU or Daily Active Users = The number of unique active users in each day of the month
Average DAU = Average DAU for the month
MAU or Monthly Active Users = Aggregate sum of daily active users over a period of one month
Stickiness would be the ratio of Average DAU and MAU.
Given below is a chart with DAU numbers and MAU along with stickiness:
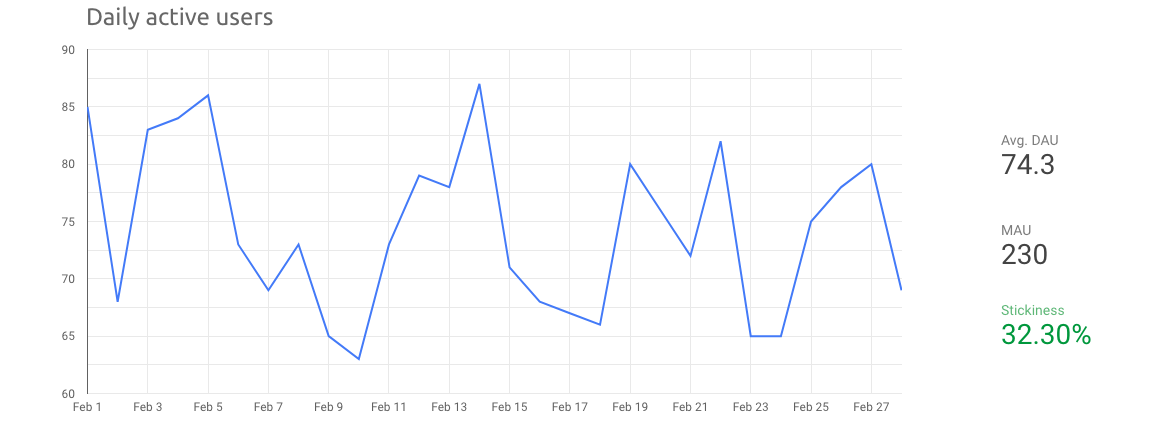
Your goal is to increase the stickiness by optimizing the engagement criteria you have defined.
Retention rate
Retention rate is an important metric as it tells how often your community members are returning to the community after a certain initial event.
This can be used to unveil the reason why members are returning and why they are not returning.
Although there are different methods of calculating retention, N Day Retention is the most commonly used method.
It literally computes the percentage of members who come back on a specific day. So, a “day 7 retention” measures the percentage of members who returned on the seventh day of your chosen time period. By selecting different time frames you can compare the changes in retention rate.
So, the initial or Day 0 trigger for retention measurement could be anything from the first visit to the first time your member followed someone.
You can use this to play with different trigger events (joined a group, followed five members, completed profile, etc.) to see which activity results in higher retention and then guide new users to follow the path that results in higher retention.
Point to ponder: is there a reason why popular social networking sites (like Twitter and Pinterest) ask you to follow a certain number of existing members when you create a new account? Likely yes. The more people you’re following, the more there will be content to encourage you to return to the platform.
This is how a retention curve looks:
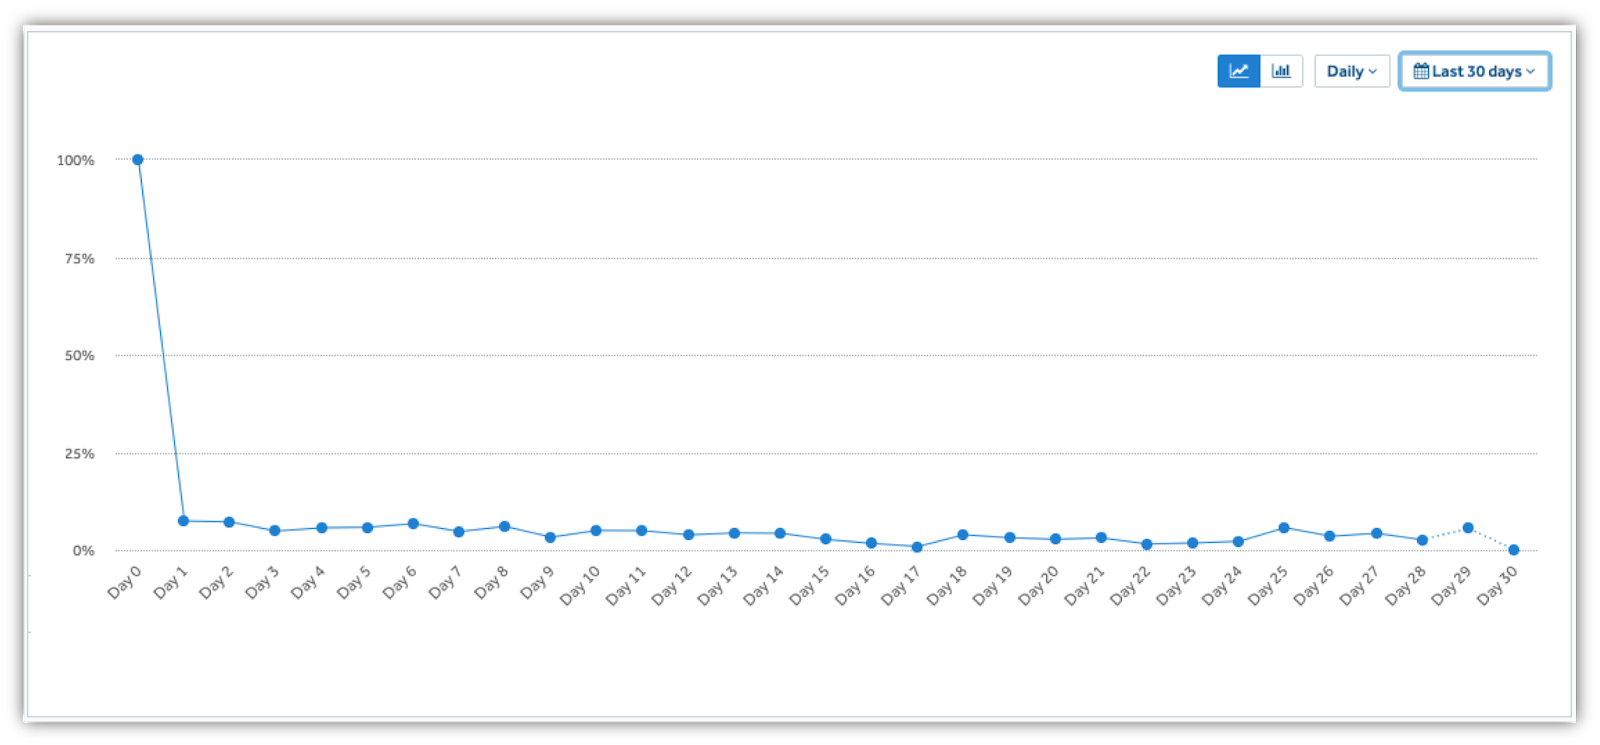
If there are 10,000 users on Day 0, then this means on Day 1 about 7% (700) of the users were retained and on Day 3 about 5% (500) of users were retained.
New contributors
Ideally, you would want the new members of your community to get engaged and start contributing as quickly as possible. This signifies that the members feel connected with the community and are interested in adding value.
Here is how this can be calculated:
(Number of new members who became contributors/Number of new users)*100
Members at different lifecycle stages
Similar to new contributors discussed above, you need to define the stages of your community members based on their activities so you can identify bottlenecks among other things. Here are some of the lifecycle stages you might consider:
- Onboarded
- Engaged
- Trusted member
- Loyal
- Evangelist
Based on this, you should create a breakdown of the number of members present in each cohort.
Your goal is to provide the best possible solution to the members in each stage so that they can move from one stage to stage. And, ultimately become the evangelist of your company.
3. Impact on the business goals
The traction that your content generates and the vitality of the community should ultimately impact the larger business goals.
If you, as a community manager, are not able to prove the positive result, then it is a very troublesome situation, but if you’re doing your due-diligence, this shouldn’t be a problem.
Based on the primary objective of the community there a finite set of business objectives with which a community can help.
The image below identifies some of the most common objectives associated with communities:
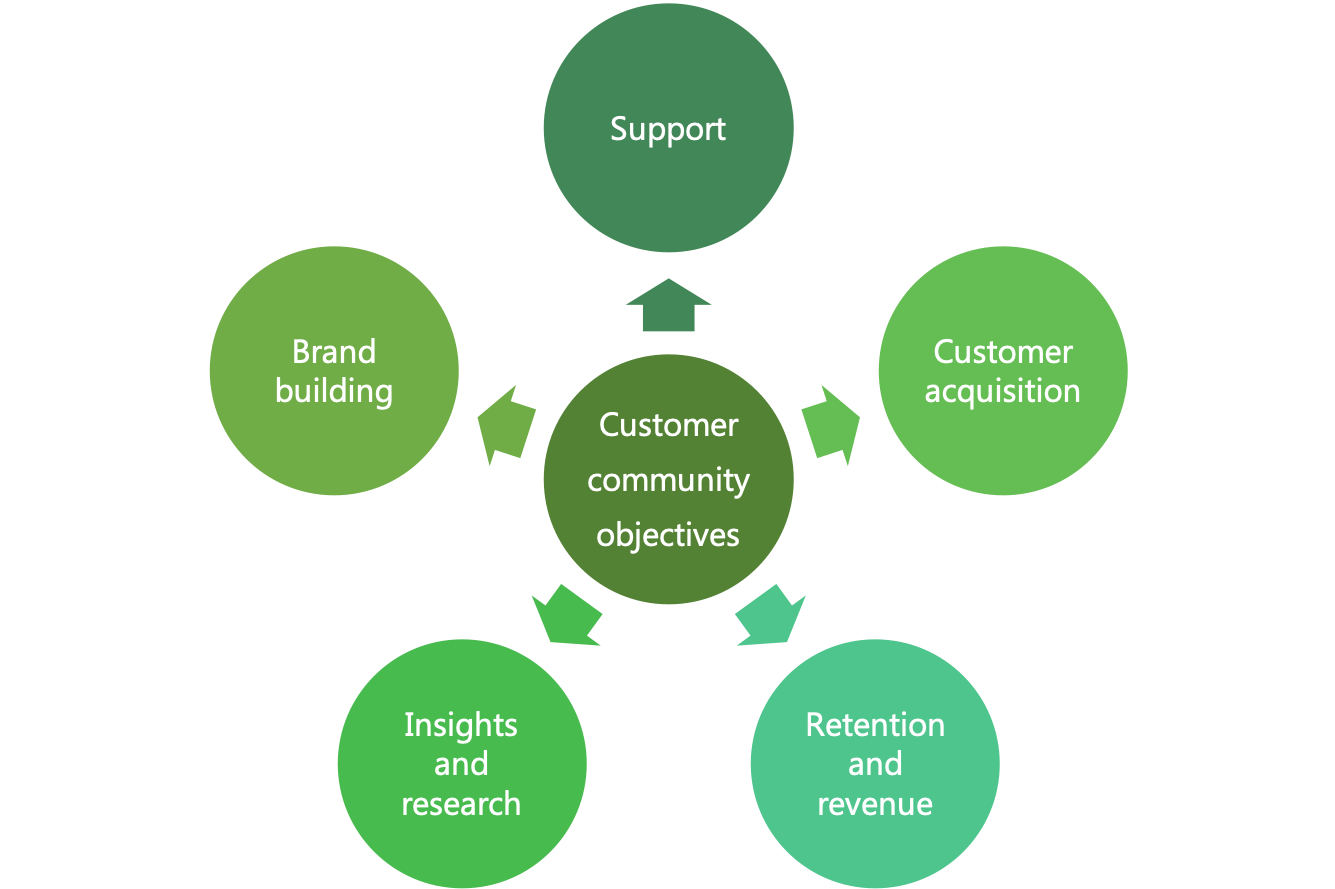
- Customer Acquisition
- Customer Support
- Brand Building
- Insights & Research
- Retention & Revenue
So, what type of metrics should you choose to evaluate the community’s impact on these five business objectives?
Let’s explore each of these based on the associated metrics:
Customer acquisition
You should find out the number of new leads acquired via your customer community and how many of them ultimately became paying customers. This helps you understand just how much of a direct profit center your community is.
You also want to measure the network of referral members -- how many new members are joining after being referred by the existing members and ultimately becoming your customers.
Customer support
Here the important metrics are the number of support queries deflected, support cost saved, and customer satisfaction score.
A community is often a highly effective place for customers to troubleshoot their own issues and avoid reaching out to your company for personal support. Looking at these metrics will help you get a good idea of just how valuable your community is in this arena.
Retention and revenue
When it comes to your objectives, you would also likely want to measure the average lifetime of the customers who are community members and those who are not members.
More specifically, for example, if you are an ecommerce company, you would be evaluating the number of transactions of members and non-members.
Again, this helps you see if there’s any correlation between your community and your actual revenue.
This can be easily done if your community is integrated with your contact management of CRM system. Tribe can send the community activity or membership data to your central contact management solution and you can apply filters in the central repository to view their contribution to your bottom line.
Insights and research
If you have a community dedicated to ideation, collecting feedback, and performing market research, you should measure the number of new features implemented in your product that originated from the community.
You can also measure the number of improvements done, issues fixed, and time to market (TTM) for the features.
Communities can be an extremely valuable source of customer insight when it comes to product development and improvement. Taking a look at these numbers will give you better insight into just how effective it is and if there are ways you can improve it.
Brand building
If your community is used as a channel to establish thought leadership and propagate unique ideas, you should check for the number of links to the concepts posted in the community. Generating media mentions for your community is also a crucial metric. This tells if you are able to generate enough buzz and news outlets are picking up your ideas to publish on their site. You can set up Google Alerts and Analytics to track these.
Another metric could be looking at the number of search queries (via Google Search Console) for your brand associated with new ideas you have shared.
If such queries surface in the Search Console, that means people have started searching for your concepts and you are heading in the right direction.
Start measuring!
We covered different types of metrics that you should be measuring -- right from identifying the traction of the user-generated content and vitality of the community, to impact of the community on the organizational goals.
This should again lead to adjustments in your community strategy and result in better alignment with the business goals. If you try to manage your community without any tracking any metric, you would be similar to a rudderless ship. Your efforts won't have any direction — you would be clueless about your goals and ROI.
A quality community software will make this easy for you by showcasing these metrics for you in a dashboard, making them easy to find.
Also, the reports should be communicated across teams, so that you can easily get internal help for brainstorming as well as execution of tasks for any improvements.
Tribe, for example, has a centralized reporting section for the admins to showcase the three crucial components of the community -- growth, engagement, and user-generated content.
Free Assessment:
/Assets/Icon%20Library/Arrows/Grey%20Arrow%20-%20Prev.svg)
/Assets/Icon%20Library/Arrows/Grey%20Arrow%20-%20Next.svg)