Subscribe now and get the latest podcast releases delivered straight to your inbox.
Valentine Spending: Stats for Planning a Lovable Last-Minute Campaign! [Infographic]

Feb 11, 2018
![Valentine Spending: Stats for Planning a Lovable Last-Minute Campaign! [Infographic]](https://www.impactplus.com/hs-fs/hubfs/valentines-day-spending.jpg?width=768&height=400&name=valentines-day-spending.jpg)
In recent years, Valentine’s Day has earned an increasingly bad rep.
Labeled as superficial and materialistic, the day celebrating love has gotten everything but from many modern consumers.
However, despite this, more than half of Americans plan on celebrating Valentine’s Day in 2018 and this engaged audience presents an extremely valuable opportunity for marketers to grab their attention and increase sales.
Don’t have anything up your sleeve?
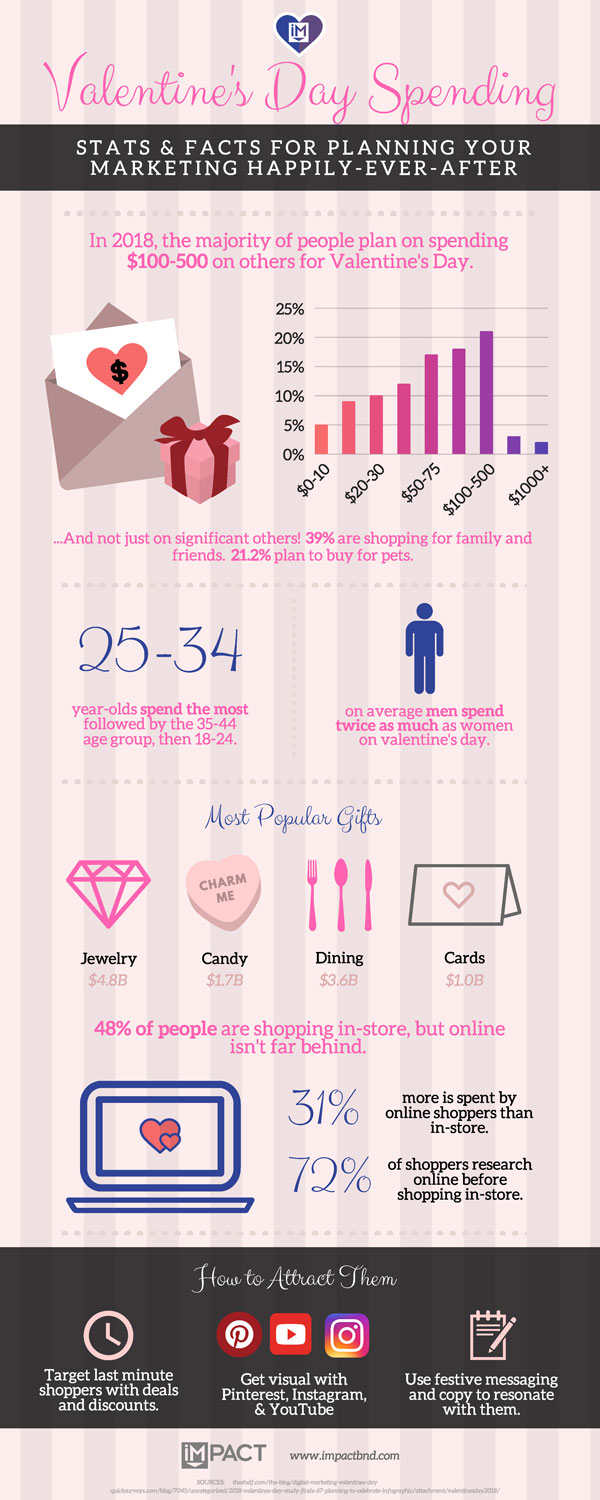
Drawing upon data and recent research from The Shelf and Tuluna QuickSurveys, I’ve compiled this handy infographic of some crucial statistics and facts to help you plan a last minute Valentine’s Day marketing campaign or fine-tune your existing one.
Here are some of the trends highlighted:
- 21% of the 1000 people surveyed by QuickSurveys plan on spending $100-500 on Valentine’s Day this year.
- Jewelry, candy, dinner, and greeting/gift cards remain the most popular gifts
- Men on average spend twice as much as women on Valentine’s Day
- Individuals 25-34 tend to spend the most on Valentine’s Day
- 48% of people are shopping in-store, but those who do shop online, spend 31% more than in-store shoppers.
- 72% of young shoppers research their purchase online before buying in-store
Check out and share the full infographic below!

Free Assessment: