/Assets/base/Navigation%20Icons/TAYA.svg)
/Assets/base/Navigation%20Icons/Sales.svg)
/Assets/base/Navigation%20Icons/Web%20design.svg)
/Assets/base/Navigation%20Icons/HubSpot.svg)
/Assets/Icon%20Library/AI%20Mastery.svg)
/Assets/Icon%20Library/Learning%20Center%20Laptop.svg)

Sep 14, 2019
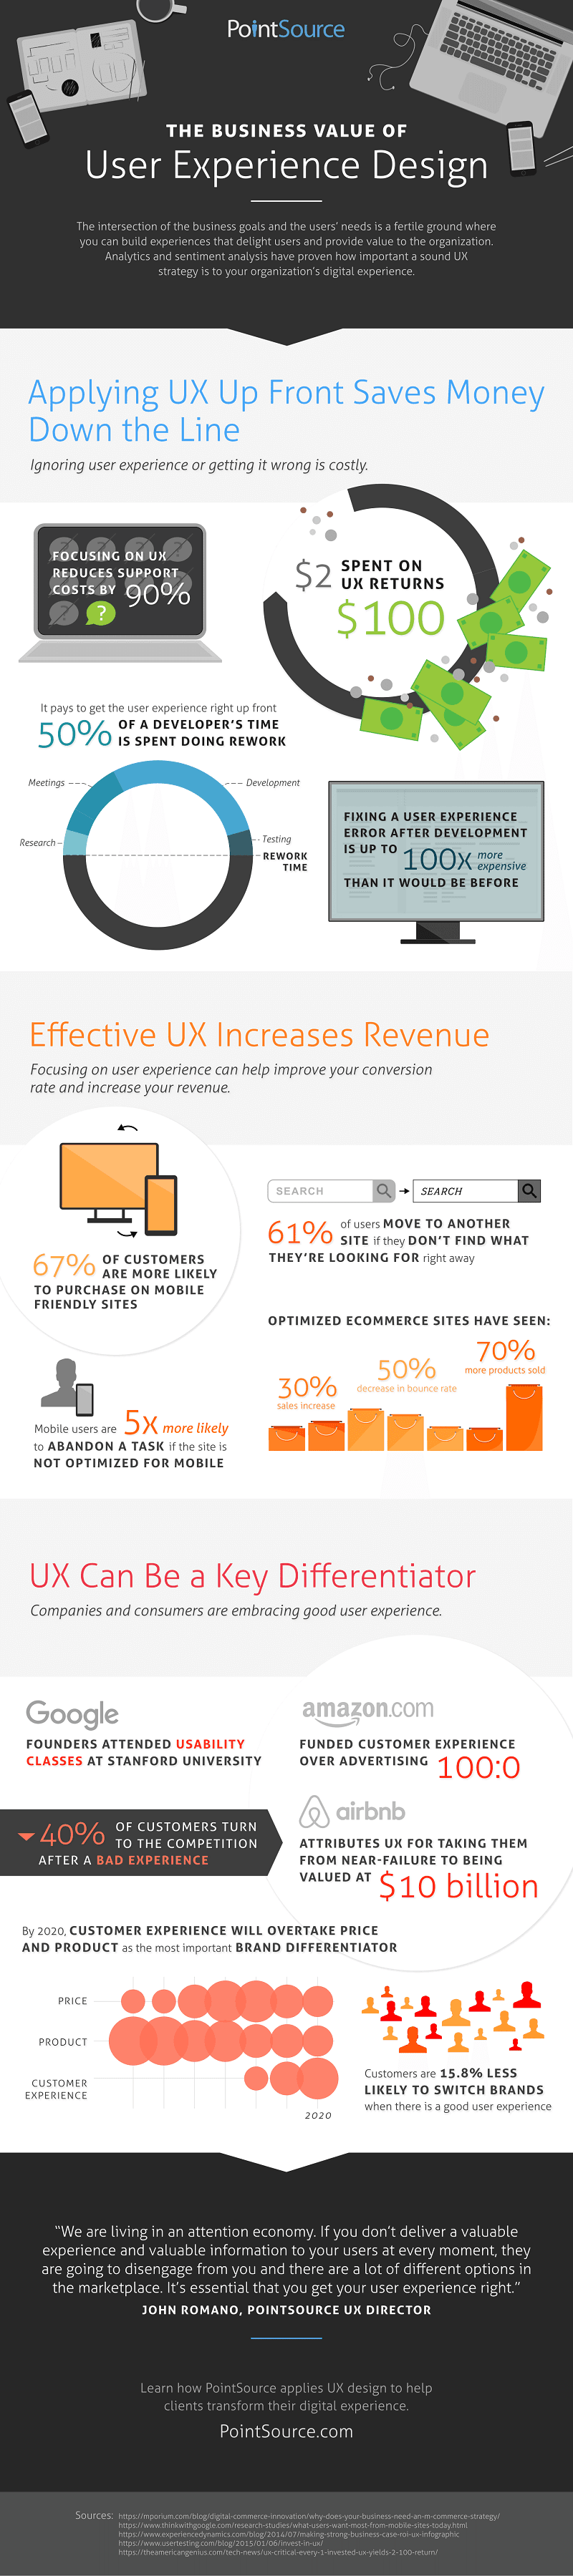
![The Business Value of UX Design [Infographic]](https://145335.fs1.hubspotusercontent-na1.net/hub/145335/hubfs/the-business-value-of-ux.jpg?width=768&height=400&name=the-business-value-of-ux.jpg)
Your website’s UX has a very important job.
One might think it’s simply to create a holistic experience for
Although these elements make up key parts to implementing UX design, its true focus lies
UX designs real goal is to create solutions that are optimized for your users which ultimately provide business value for your organization.
Unfortunately, many organizations are still blind to the potential implementing UX tactics will have on their businesses value.
But the harsh reality is that your website is faced with a challenge to differentiate itself from 10-100+ competitors it faces daily. When it fails to shine, what's going to get your visitors to choose your product over a competitor's?
This is why investing more time into your website's UX is so valuable to your organization. Proper execution of it helps your users understand how to interpret your company and your product(s). It also allows them to get a sense of your brands feel and whether or not you may be an ideal emotional and personable fit too.
When more and more users find your website's UX pleasing them the most, they’ll keep coming back. In fact, “companies with highly effective UX have increased their revenue by 37%, and top 10 UX leaders in America outperform the S&P with close to triple the returns” (UXpassion).
It’s clear that companies who fail to provide an optimal experience for
Before checking out the full infographic, here’s a sneak peek at some of its compelling statistics:
- Looking to save money? “Fixing a user experience error after development is up to 100x more expensive than it would be before.” This means locking down broken UX design early is necessary to avoid spending more money to
band aid issues. - Think your website doesn’t have the best navigation? Then say goodbye to a
chuck of potential customers. “61% of users move to another site if they aren’t able to find what they’re looking for right away.” - Pricing and product both currently hold the top spots as company differentiators. But that won’t last for long. “By 2020, customer experience will overtake price and product as the most important brand differentiator.”
Order Your Copy of Marcus Sheridan's New Book — Endless Customers!
/Assets/Icon%20Library/x%20corp.svg)
/Assets/Icon%20Library/whatsapp%20logo.svg)
/Assets/Icon%20Library/Email.svg)
/Assets/Icon%20Library/Arrows/Grey%20Arrow%20-%20Prev.svg)
/Assets/Icon%20Library/Arrows/Grey%20Arrow%20-%20Next.svg)