Free Assessment: How does your inbound marketing measure up?

Get Started
Close

Free Assessment:

How does your inbound marketing measure up?
Take this free, 5-minute assessment and learn what you can start doing today to boost traffic, leads, and sales.
Get Started
inbound-marketing-strategy-playbook-cover

Free Assessment:

10 Visual Content Marketing Statistics to Know for 2017 [Infographic]

By Joe Rinaldi

10 Visual Content Marketing Statistics to Know for 2017 [Infographic]

With every new year comes new trends. This year will be no different. We’ll see trends and practices such as long scrolling pages continue to grow in popularity, while others will be phased out. (I’m looking at you Flash).

Visual content marketing has been on the rise since 2013 and shows no signs of slowing down in 2017. The surge of video and other new mediums that make it easier to communicate with people have played a major role in keeping this trend in the spotlight.

In fact, according to an article published by HubSpot, people are more likely to retain and engage with content when it is paired with a relevant image. Taking note, Venngage, an infographic creation platform, surveyed over 300 marketing professionals to see just how much of a role visual content plays in their marketing strategies.

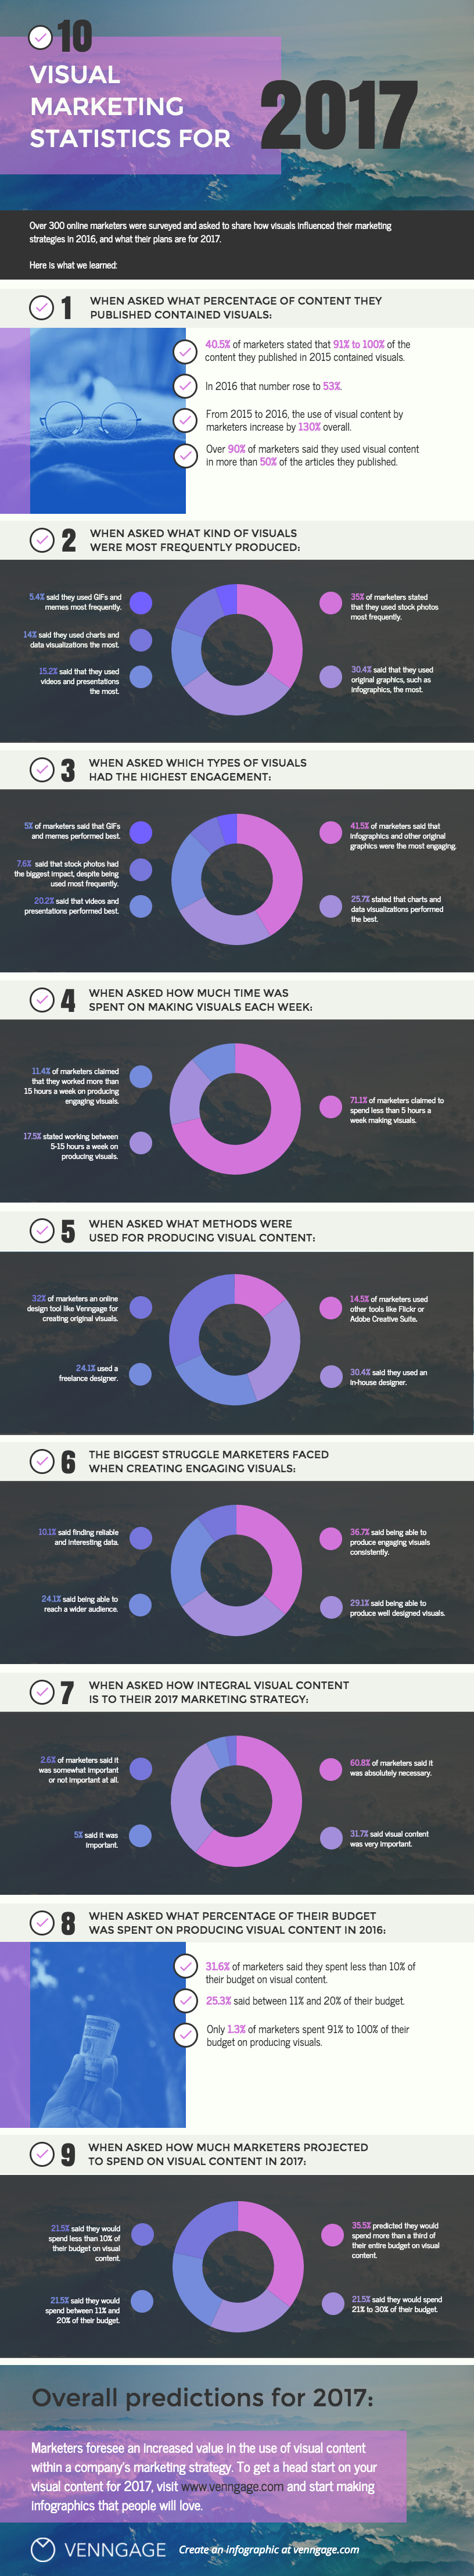
The results from the survey were turned into the infographic pictured below. A few key stats from the infographic include:

  • 53%  of marketers stated that 91% to 100% of the content they published in 2016 contained visuals

  • When asked what kind of visuals were most frequently produced 35% of marketers said that they used stock photos the most, followed by 30.4% saying they used original graphics, such as infographics, the most.

  • 41.5% of marketers said that infographics had the highest engagement

  • 71.1% of marketers claimed to spend less than five hours a week making visuals

  • 31.7% of those surveyed said that visual content was integral to their 2017 marketing strategy.

  • When asked how much marketers projected to spend on visual content in 2017, 35.5% predicted they would spend more than a third of their entire budget on visual content.

The stats produced by the Venngage team prove that visual content is a trend that’s here to stay in 2017.

visual-content-marketing-statistics.png

Free Assessment:

How does your inbound marketing measure up?
Take this free, 5-minute assessment and learn what you can start doing today to boost traffic, leads, and sales.

Topics:

Infographics
Marketing Statistics
Published on January 16, 2017

Recent Articles

12 Tips for Improving Team Communication in Every Workplace [Infographic]
October 13, 2022 • 5 min read
What Are the Most Popular Types of YouTube Videos in 2021? [Infographic]
May 19, 2021 • 6 min read
88 compelling words and phrases to prompt website visitors into action [Infographic]
April 24, 2021 • 3 min read
7 must-have word-of-mouth marketing strategies [Infographic]
April 18, 2021 • 4 min read
The psychological meaning of shapes in logo design [Infographic]
April 17, 2021 • 1 min read
Content marketing in uncertain times: trends and facts to know in the ongoing pandemic [infographic]
February 27, 2021 • 3 min read
Top B2B digital marketing trends to look out for in 2021 [Infographic]
February 20, 2021 • 3 min read
Chatbot customer service statistics and trend you've got to see for 2021 [infographic]
February 13, 2021 • 3 min read
Does backlinking still matter for your SEO? [Infographic]
February 6, 2021 • 3 min read
5 tips for maintaining team solidarity while working remote [Infographic]
January 30, 2021 • 5 min read
Marketing and Sales Alignment When Using HubSpot and Salesforce [Infographic]
January 16, 2021 • 1 min read
Top design tips for e-commerce website success in 2021 [Infographic]
January 9, 2021 • 2 min read
The top 10 social media trends for brand survival in 2021 [Infographic]
January 2, 2021 • 4 min read
How to dominate your space with the HubSpot-WordPress plugin [Infographic]
December 19, 2020 • 3 min read
7 graphic design trends that will dominate 2021 [Infographic]
November 28, 2020 • 5 min read
Two key focus areas to optimize your blog conversion rate [Infographic]
November 21, 2020 • 3 min read
Chrome is saying goodbye to third-party cookies: How can marketers pivot? [Infographic]
November 14, 2020 • 1 min read
The importance of body language in your next big job interview [Infographic]
November 1, 2020 • 7 min read
Expert tips on designing for color blindness — from a color-blind designer [Infographic]
October 11, 2020 • 2 min read
How to handle negative thoughts and emotions at work [Infographic]
October 4, 2020 • 4 min read
9 keys to building an effective landing page [Infographic]
October 3, 2020 • 3 min read
Why website speed matters even more than ever in 2020 [Infographic]
September 27, 2020 • 2 min read
55 key design and UX stats to guide your next website redesign (Infographic)
September 12, 2020 • 2 min read
The eye-opening influence of Instagram on buying [Infographic]
September 6, 2020 • 1 min read
3 reasons why company culture matters (and how to build yours) [Infographic]
September 5, 2020 • 3 min read