Free Assessment: How does your sales & marketing measure up?

Get Started
Close

Free Assessment:

How does your sales & marketing measure up?
Take this free, 5-minute assessment and learn what you can start doing today to boost traffic, leads, and sales.
Get Started
Infographics  |   Hiring a Marketing Team

The Endless Hunt for the Perfect Work-Life Balance [Infographic]

Joe Rinaldi

By Joe Rinaldi

Sep 2, 2017

The Endless Hunt for the Perfect Work-Life Balance [Infographic]

In today’s tech-driven marketing world, it can be incredibly difficult to find uninterrupted time to relax and disconnect from the office.

For those of you who find yourself constantly checking emails on long weekends like this one or while watching the latest episode of American Horror Story (myself included), you begin to wonder if the glorified “Work-Life Balance” is a real thing or just a myth.

If there's a silver lining to this conflict, it’s that you’re not the only one struggling to find the perfect balance.

OnePoll, a market research firm, conducted a 2,000 person survey on behalf of the coupon giant Groupon to find how people typically feel about their work-life balance and the results of the survey were turned into the infographic below.

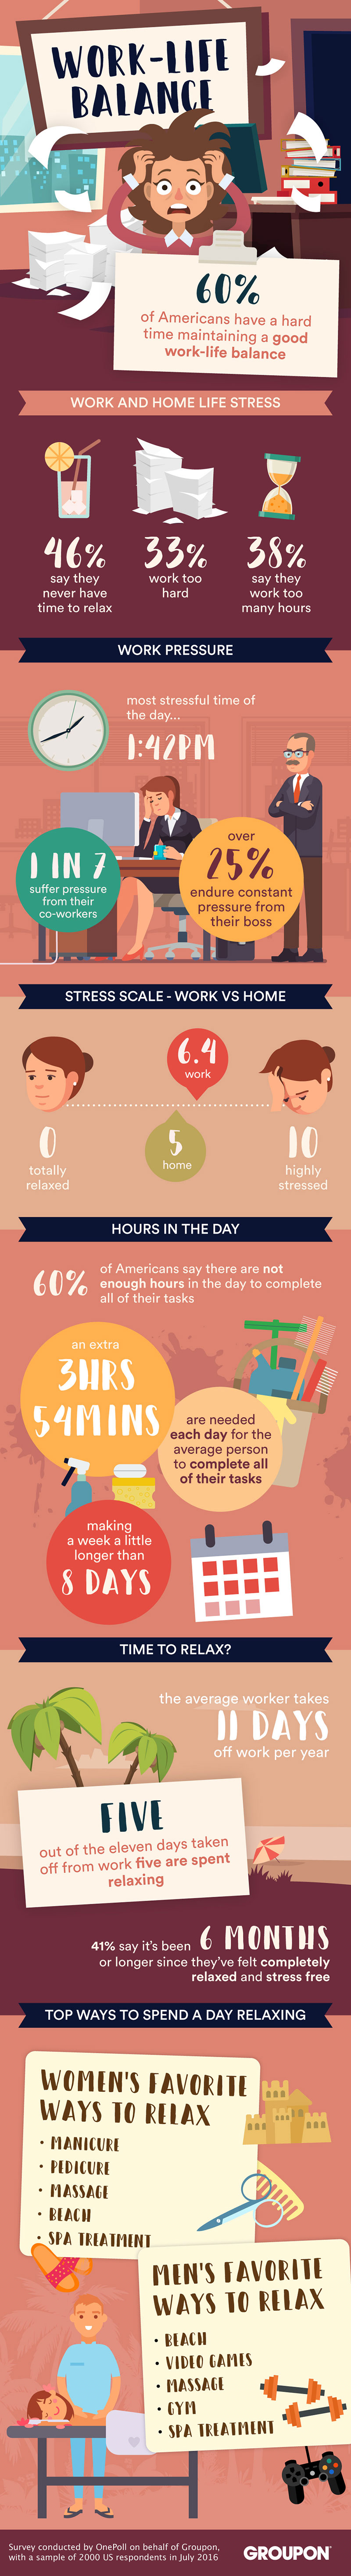
In the piece, Groupon notes that “almost 60% of Americans have a hard time maintaining a work-life balance.” Aside from it being difficult to find their equilibrium, they also generally feel more stress in the workplace as a result of burnout and a never-ending task list.

Some of the more significant workplace stats from the infographic include:

  • 1 in 7 people suffer pressure from their coworkers, but over 25% endure constant pressure from their boss.
  • 60% of Americans say there are not enough hours in a day to complete all of their tasks.
  • 41% of people say it’s been 6 months or longer since they’ve felt completely relaxed and stress-free.

If these stats are beginning to add to your stress, don’t worry!

The infographic also mentions some of the top activities people like to do to relax. Some of the activities include getting manicures or massages for women, while most men may opt for  playing video games, going to the beach, or getting a spa treatment.

Curious to see how your work-life balance measures up to the average American? Check out the full infographic below.

work-life-balance_full_infographic_gm.jpg


Free Assessment:

How does your sales & marketing measure up?
Take this free, 5-minute assessment and learn what you can start doing today to boost traffic, leads, and sales.

Related Articles

7 Must-have Word-of-Mouth Marketing Strategies [Infographic]

May 8, 2023
Joe Rinaldi Joe Rinaldi

8 Smart Ways to Collect Customer Feedback [infographic]

May 4, 2023
Joe Rinaldi Joe Rinaldi

12 Tips for Improving Team Communication in Every Workplace [Infographic]

October 13, 2022
Joe Rinaldi Joe Rinaldi

What Are the Most Popular Types of YouTube Videos in 2021? [Infographic]

May 19, 2021
Joe Rinaldi Joe Rinaldi

88 compelling words and phrases to prompt website visitors into action [Infographic]

April 24, 2021
Kaitlyn Petro Kaitlyn Petro

The psychological meaning of shapes in logo design [Infographic]

April 17, 2021
Joe Rinaldi Joe Rinaldi

Content marketing in uncertain times: trends and facts to know in the ongoing pandemic [infographic]

February 27, 2021
Joe Rinaldi Joe Rinaldi

Top B2B digital marketing trends to look out for in 2021 [Infographic]

February 20, 2021
Joe Rinaldi Joe Rinaldi

Chatbot customer service statistics and trend you've got to see for 2021 [infographic]

February 13, 2021
Kaitlyn Petro Kaitlyn Petro

Does backlinking still matter for your SEO? [Infographic]

February 6, 2021
Melanie Moore Melanie Moore

5 tips for maintaining team solidarity while working remote [Infographic]

January 30, 2021
Carolyn Edgecomb Carolyn Edgecomb

Marketing and Sales Alignment When Using HubSpot and Salesforce [Infographic]

January 16, 2021
Joe Bachir Joe Bachir

Top design tips for e-commerce website success in 2021 [Infographic]

January 9, 2021
Joe Rinaldi Joe Rinaldi

The top 10 social media trends for brand survival in 2021 [Infographic]

January 2, 2021
Joe Rinaldi Joe Rinaldi

How to dominate your space with the HubSpot-WordPress plugin [Infographic]

December 19, 2020
Melanie Moore Melanie Moore

7 graphic design trends that will dominate 2021 [Infographic]

November 28, 2020
Joe Rinaldi Joe Rinaldi

Two key focus areas to optimize your blog conversion rate [Infographic]

November 21, 2020
Carolyn Edgecomb Carolyn Edgecomb

Chrome is saying goodbye to third-party cookies: How can marketers pivot? [Infographic]

November 14, 2020
Joe Rinaldi Joe Rinaldi

The importance of body language in your next big job interview [Infographic]

November 1, 2020
Joe Rinaldi Joe Rinaldi

Expert tips on designing for color blindness — from a color-blind designer [Infographic]

October 11, 2020
Joe Rinaldi Joe Rinaldi

How to handle negative thoughts and emotions at work [Infographic]

October 4, 2020
Melissa Smith Melissa Smith

9 keys to building an effective landing page [Infographic]

October 3, 2020
Joe Rinaldi Joe Rinaldi

Why website speed matters even more than ever in 2020 [Infographic]

September 27, 2020
Melanie Moore Melanie Moore

55 key design and UX stats to guide your next website redesign (Infographic)

September 12, 2020
Joe Rinaldi Joe Rinaldi

The eye-opening influence of Instagram on buying [Infographic]

September 6, 2020
Melissa Smith Melissa Smith