Free Assessment: How does your sales & marketing measure up?

Get Started
Close

Free Assessment:

How does your sales & marketing measure up?
Take this free, 5-minute assessment and learn what you can start doing today to boost traffic, leads, and sales.
Get Started
Infographics  |   Sales & Marketing Technology

What Entering an Era of Disruption Means for Your Business [Infographic]

Dan Baum

By Dan Baum

Jan 6, 2019

What Entering an Era of Disruption Means for Your Business [Infographic]

We’ve seen a lot of disruptive technology within the last decade.

Innovations things like 3D printing, electric cars, the internet of things (IoT), virtual reality, and artificial intelligence have all shaken industries worldwide, including marketing with things like chat bots and A.I.

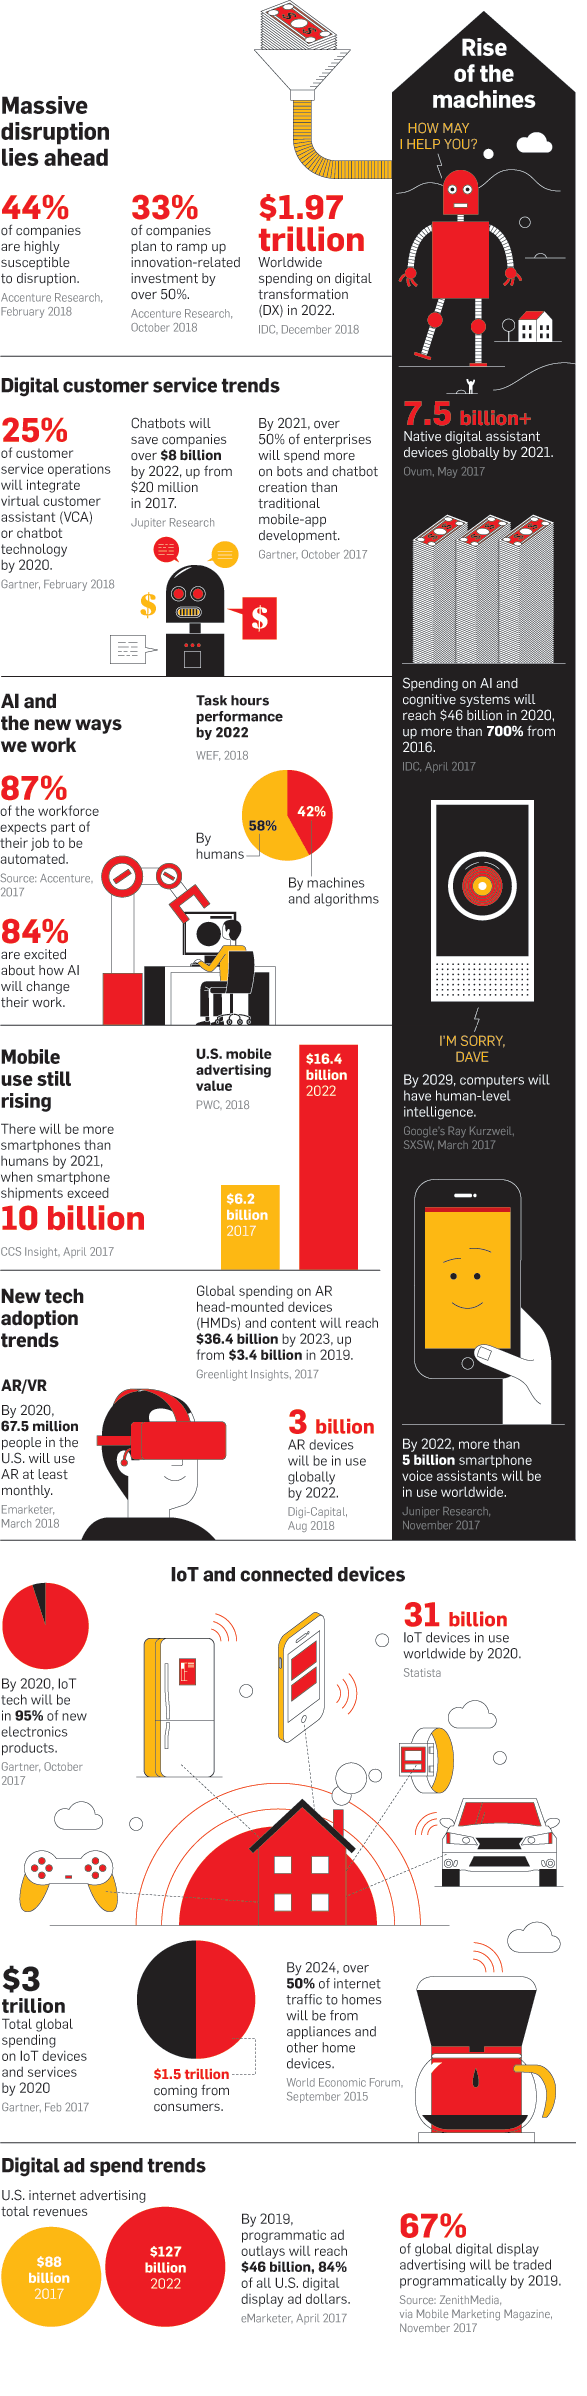
As 2018 comes to a close, we are entering a brand new era of disruption according to research compiled into this infographic by AdWeek.

Accenture Interactive predicts that more than half of the workforce will have to learn new skills within the next five years due to human-machine collaboration.

To top it all off, over one-third of companies are planning to increase their innovation-related investments by over half.

Spending on technology and services is also predicted to reach 1.97 trillion by 2022.

Jaime Posnanski, the global content lead at Accenture Interactive predicts “rapid, continued evolution as new technologies mature and are seamlessly integrated into a connected suite of tools and platforms."

Big brands and small brands across the globe are trying to transform the experiences customers have with them, and they are desperate for the technology to make that happen.

This infographic proves the migration into an even more technologically disruptive era and explains “why” there is such an increased desire for newer and better tech. Here are some of the main takeaways:

  • Spending on AI technology will increase to $46 billion by 2020, a 700% increase since 2016.

  • By 2024, more than half of all internet traffic per household will go to IoT appliances, aka NOT computers/cell phones.

  • Next year 84% of all advertising dollars will be spent on programmatic ad overlays ad companies move away from print and television advertising.

  • By 2029, computers will have human-level intelligence.

Check out the rest of the research in the full infographic here:

disruption-infographic

Free Assessment:

How does your sales & marketing measure up?
Take this free, 5-minute assessment and learn what you can start doing today to boost traffic, leads, and sales.

Related Articles

7 Must-have Word-of-Mouth Marketing Strategies [Infographic]

May 8, 2023
Ramona Sukhraj Ramona Sukhraj

8 Smart Ways to Collect Customer Feedback [infographic]

May 4, 2023
Ramona Sukhraj Ramona Sukhraj

12 Tips for Improving Team Communication in Every Workplace [Infographic]

October 13, 2022
Ramona Sukhraj Ramona Sukhraj

What Are the Most Popular Types of YouTube Videos in 2021? [Infographic]

May 19, 2021
Ramona Sukhraj Ramona Sukhraj

88 compelling words and phrases to prompt website visitors into action [Infographic]

April 24, 2021
Kaitlyn Petro Kaitlyn Petro

The psychological meaning of shapes in logo design [Infographic]

April 17, 2021
Ramona Sukhraj Ramona Sukhraj

Content marketing in uncertain times: trends and facts to know in the ongoing pandemic [infographic]

February 27, 2021
Joe Rinaldi Joe Rinaldi

Top B2B digital marketing trends to look out for in 2021 [Infographic]

February 20, 2021
Nicole Letendre Nicole Letendre

Chatbot customer service statistics and trend you've got to see for 2021 [infographic]

February 13, 2021
Kaitlyn Petro Kaitlyn Petro

Does backlinking still matter for your SEO? [Infographic]

February 6, 2021
Melanie Moore Melanie Moore

5 tips for maintaining team solidarity while working remote [Infographic]

January 30, 2021
Carolyn Edgecomb Carolyn Edgecomb

Marketing and Sales Alignment When Using HubSpot and Salesforce [Infographic]

January 16, 2021
Joe Bachir Joe Bachir

Top design tips for e-commerce website success in 2021 [Infographic]

January 9, 2021
Chelsea Boice Chelsea Boice

The top 10 social media trends for brand survival in 2021 [Infographic]

January 2, 2021
Joe Rinaldi Joe Rinaldi

How to dominate your space with the HubSpot-WordPress plugin [Infographic]

December 19, 2020
Melanie Moore Melanie Moore

7 graphic design trends that will dominate 2021 [Infographic]

November 28, 2020
Joe Rinaldi Joe Rinaldi

Two key focus areas to optimize your blog conversion rate [Infographic]

November 21, 2020
Carolyn Edgecomb Carolyn Edgecomb

Chrome is saying goodbye to third-party cookies: How can marketers pivot? [Infographic]

November 14, 2020
Chelsea Boice Chelsea Boice

The importance of body language in your next big job interview [Infographic]

November 1, 2020
Kate Fodera Kate Fodera

Expert tips on designing for color blindness — from a color-blind designer [Infographic]

October 11, 2020
Joe Rinaldi Joe Rinaldi

How to handle negative thoughts and emotions at work [Infographic]

October 4, 2020
Melissa Smith Melissa Smith

9 keys to building an effective landing page [Infographic]

October 3, 2020
Steve Polito Steve Polito

Why website speed matters even more than ever in 2020 [Infographic]

September 27, 2020
Melanie Moore Melanie Moore

55 key design and UX stats to guide your next website redesign (Infographic)

September 12, 2020
Chelsea Boice Chelsea Boice

The eye-opening influence of Instagram on buying [Infographic]

September 6, 2020
Melissa Smith Melissa Smith