/Assets/base/Navigation%20Icons/TAYA.svg)
/Assets/base/Navigation%20Icons/Sales.svg)
/Assets/base/Navigation%20Icons/Web%20design.svg)
/Assets/base/Navigation%20Icons/HubSpot.svg)
/Assets/Icon%20Library/AI%20Mastery.svg)
/Assets/Icon%20Library/Learning%20Center%20Laptop.svg)

Mar 1, 2020
![YouTube's top stats for 2020 tell who’s watching what, when [Infographic]](https://www.impactplus.com/hs-fs/hubfs/YT%20Stats.jpg?width=768&height=400&name=YT%20Stats.jpg)
As marketers, we all understand the importance of content for a business and brand.
With video being at the forefront of digital content consumption, it's clear it should be a part of your business marketing strategy and for many types of businesses, YouTube is the platform to house it.
Video in sales and marketing
Video is shortening the consideration stage of the buyer’s journey and helping guide consumers in their decision-making.
According to Social Media Today, "97% of video marketers report that video helps users understand their products or services better. It also helps to increase sales."
Whether you’re a first-time YouTube creator looking to increase your subscriber base, or an experienced video marketer looking to increase your brand’s video reach on YouTube, the first step towards understanding and mastering this platform is to consider the numbers.
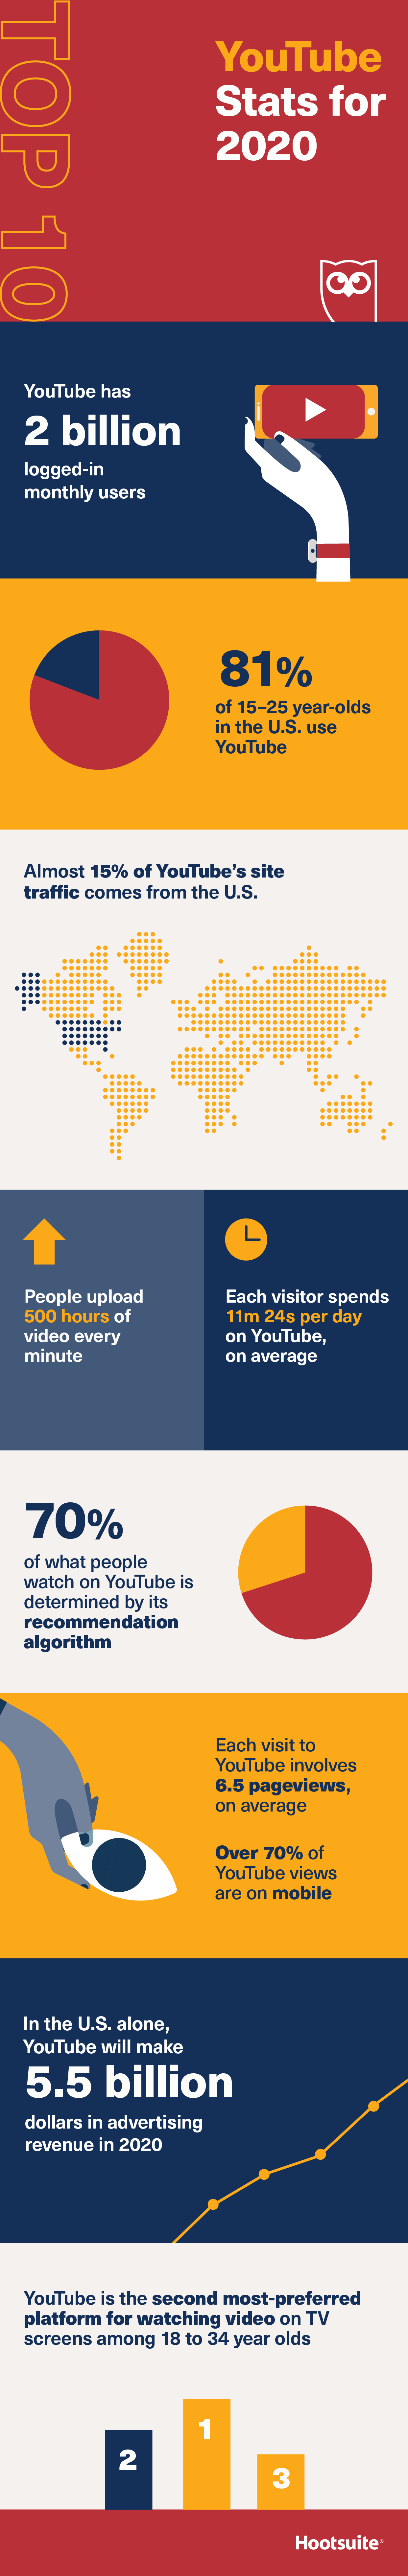
In the infographic below, provided by Hootsuite, you’ll find leading statistics to prepare you for YouTube success in 2020.
Let's dive a little bit deeper together into who is watching content on YouTube, how they are watching it, and what they are watching, in order to inform your video marketing strategy.
Who’s watching?
Two billion active monthly users
According to data collected by Statista, YouTube currently has 2 billion monthly active users, up from around 1.8 billion in 2018.
With more users comes more opportunities to reach a new audience.
Marketers can really still tailor their content to their specific audience and feel comfortable that their users are likely on the platform.
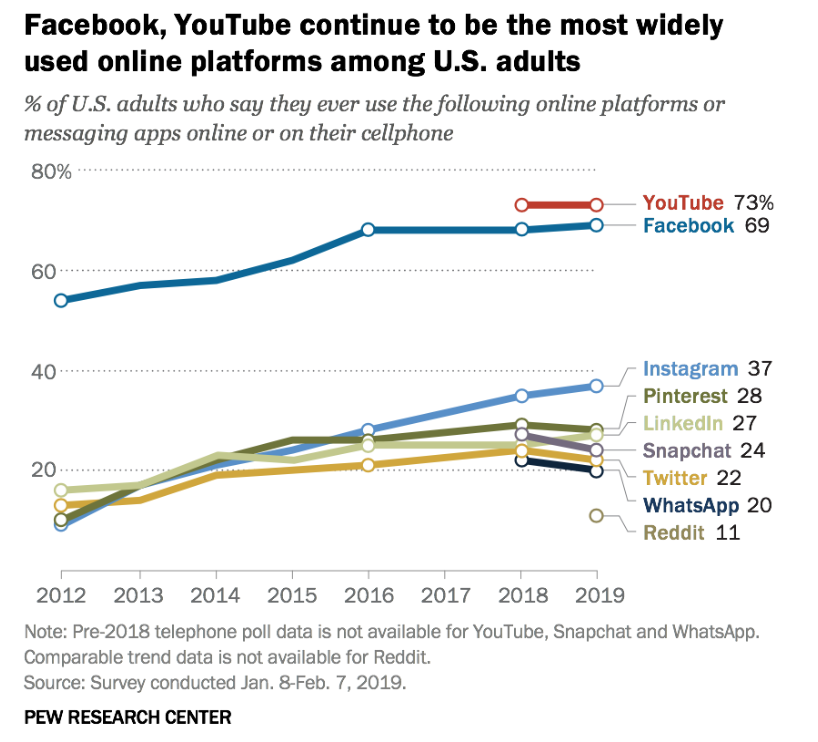
Facebook continues to be the leading social media site for US adults.
However, according to a study by Pew Research, "YouTube is the only other online platform measured that matches Facebook’s reach: 73% of adults report using the video-sharing site.”
According to Social Media Today: 81% of 15-25-year-olds in the US use YouTube.
To back that up, a HubSpot study reported that: "59% of Generation Z (16-24-year-olds) have increased their YouTube usage since 2018."
15% of YouTube site traffic comes from the US
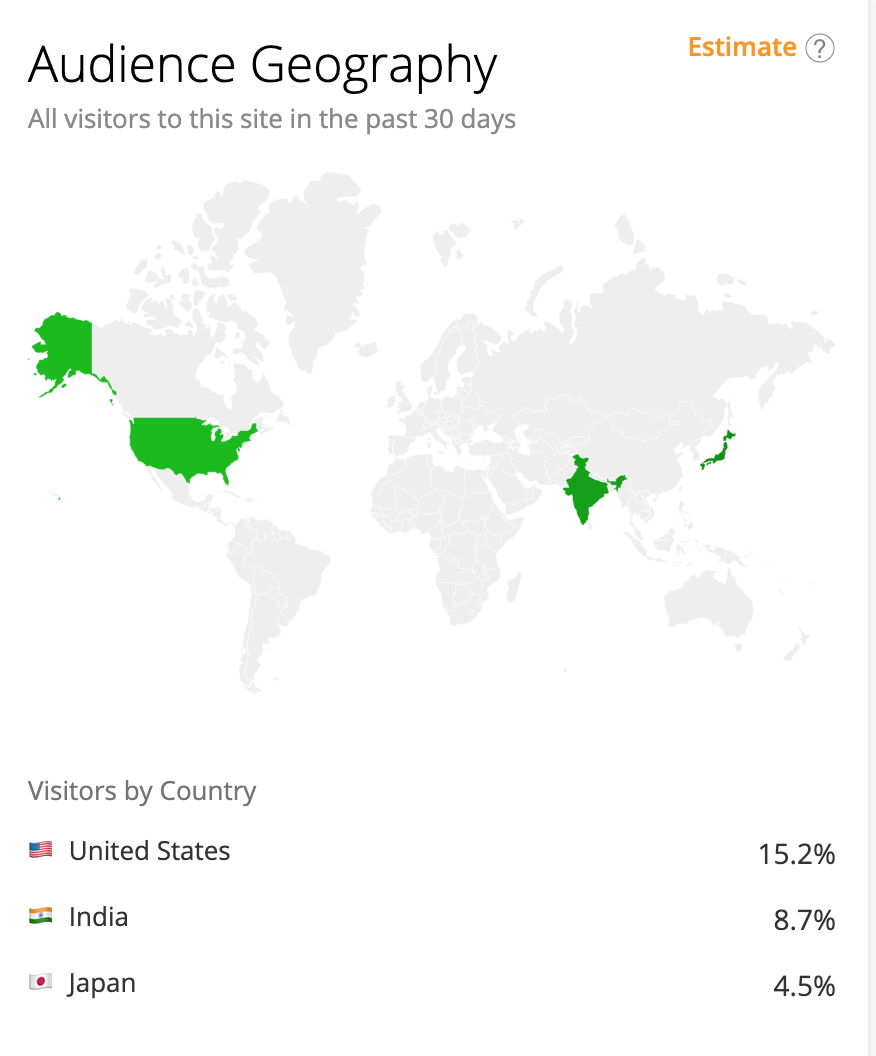
According to an Alexa study, the US generates the most YouTube traffic out of any other country, with an estimated 15%. India and Japan followed.
It’s worth noting that the world’s most populous country, China, has blocked YouTube since 2009.
A staggering volume of uploads
YouTube users upload more than 500 hours of content per minute.
That works out to 30,000 hours of new content per hour, and 720,000 hours of new content per day, according to a report by tubefilter.com.
That is a lifetime’s worth of content, uploaded each day meaning there is a lot of competition.
Key takeaway
Many businesses might still believe that their audience is not present on YouTube, but the stats prove otherwise.
YouTube is the second largest search engine tool in the world, right behind Google, its parent company.
It has an extensive and active market that businesses have the potential to tap into. And, since a vast number of YouTube users visit the platform on a daily basis, it holds great potential for organic reach.
How are people watching YouTube?
YouTube visit time
According to Social Media Today, each visitor spends an average of eleven minutes 24 seconds per day on YouTube, which is an increase from eight minutes 41 seconds in 2018.
As the platform’s algorithm continues to better align content with viewer interests, viewers are spending a longer time on the platform.
As such, typical YouTube engagement involved 6.5 page views per visit.
Mobile usage continues to rise
70% of YouTube views are on mobile devices, which should come as no surprise, as we rely on our mobile devices for pretty much everything nowadays.
Key takeaway
As marketers, we need to adapt to consumer behavior and give them content in the way they want it most. YouTube has created a great mobile experience for its audience. No matter the platform we use, our content must be responsive and mobile-ready.
What are people watching on YouTube?
YouTube is the second-most-preferred platform for watching videos on TV screens among 18 to 34-year-olds, after Netflix.
The vast array of content on YouTube can offer unique, memorable experiences for users.
With a broad decrease in cable subscriptions and a rise in streaming platforms, YouTube has further positioned itself well with the introduction of YouTube TV.
YouTube TV made its debut in 2017, changing the game for cable television.
YouTube TV offers a cable-TV-like experience through a variety of devices including Apple TV, Roku, Android TV, Chromecast, Amazon Fire TV, as well as numerous smart TVs, phones, tablets, and web browsers.
YouTube's user-centered algorithm
70% of YouTube's content consumption is determined by the platform’s recommendation algorithm.
As marketers, we depend heavily on algorithms from social platforms. Understanding these algorithms is crucial for marketers to engage and maintain their audience.
To give us insight into how it works, Hubspot published a detailed article on the ever-changing YouTube algorithm.
According to Clifford Chi, "YouTube’s algorithm serves the most relevant, personalized videos to their users on five different sections of their platform: search, home, suggested videos, trending, and subscriptions."
In essence, YouTube follows its audience engagement very closely, tracking the videos users watch and do not watch, their time spent on the platform, if they like or dislike a video, as well as any negative feedback on videos.
This is very useful for business owners and marketers who rely on analytics in order to understand the video content their audience actually wants.
YouTube as a learning tool
Recent statistics provided by Social Media Today show:
- 72% of consumers use video to learn about a product instead of reading the text in a user's manual
- "How to" searches on YouTube increase by 70% every year
- 95% of users watch an explainer video to learn more about a product or service
YouTube is even showing up in classrooms as a multifaceted learning tool. Top Hat provided some insight into the effectiveness of YouTube as a learning tool:
"Of all the videos watched in a single day around the world, one billion of those are learning-related videos. That includes edutainment (often hosted by subject-matter experts), how-to or curriculum-based videos (often hosted by educators or experts) and skills-based learning videos for teachers."
As marketers and business owners, we are the educators for our specific industry.
YouTube is an amazing platform for housing content that educates viewers.
Key takeaway
When consumers are looking to research and find out more about ANYTHING, Google and YouTube are usually the first stops.
YouTube can help improve your brand presence by allowing marketers to engage users with unique content that's easy to consume and share.
Educating your audience on your product or service can influence their buying decisions and therefore increase, leads, sales, and awareness for your business.
YouTube for Marketers
Utilizing YouTube regularly for your organization can be a cost-effective part of your marketing strategy.
YouTube is not just an entertainment platform anymore. Rather, it is an amazing marketing tool to fuel your video marketing strategy, helping businesses reach their audience in the way viewers want to consume content.
Check out the infographic below for detailed statistics to fuel your YouTube video marketing strategy!
https://blog.hootsuite.com/youtube-stats-marketers/
Free Assessment:
/Assets/Icon%20Library/x%20corp.svg)
/Assets/Icon%20Library/whatsapp%20logo.svg)
/Assets/Icon%20Library/Email.svg)
/Assets/Icon%20Library/Arrows/Grey%20Arrow%20-%20Prev.svg)
/Assets/Icon%20Library/Arrows/Grey%20Arrow%20-%20Next.svg)